
Jag kommer att delta i Märsta kulturförenings medlemsutställning med temat ”Märsta” 14 februari – 1 mars 2026 i Kulturstugan www.marstakulturstuga.se
Jag kommer att ha en separatutställning i Missionskyrkan i Uppsala i februari 2026.
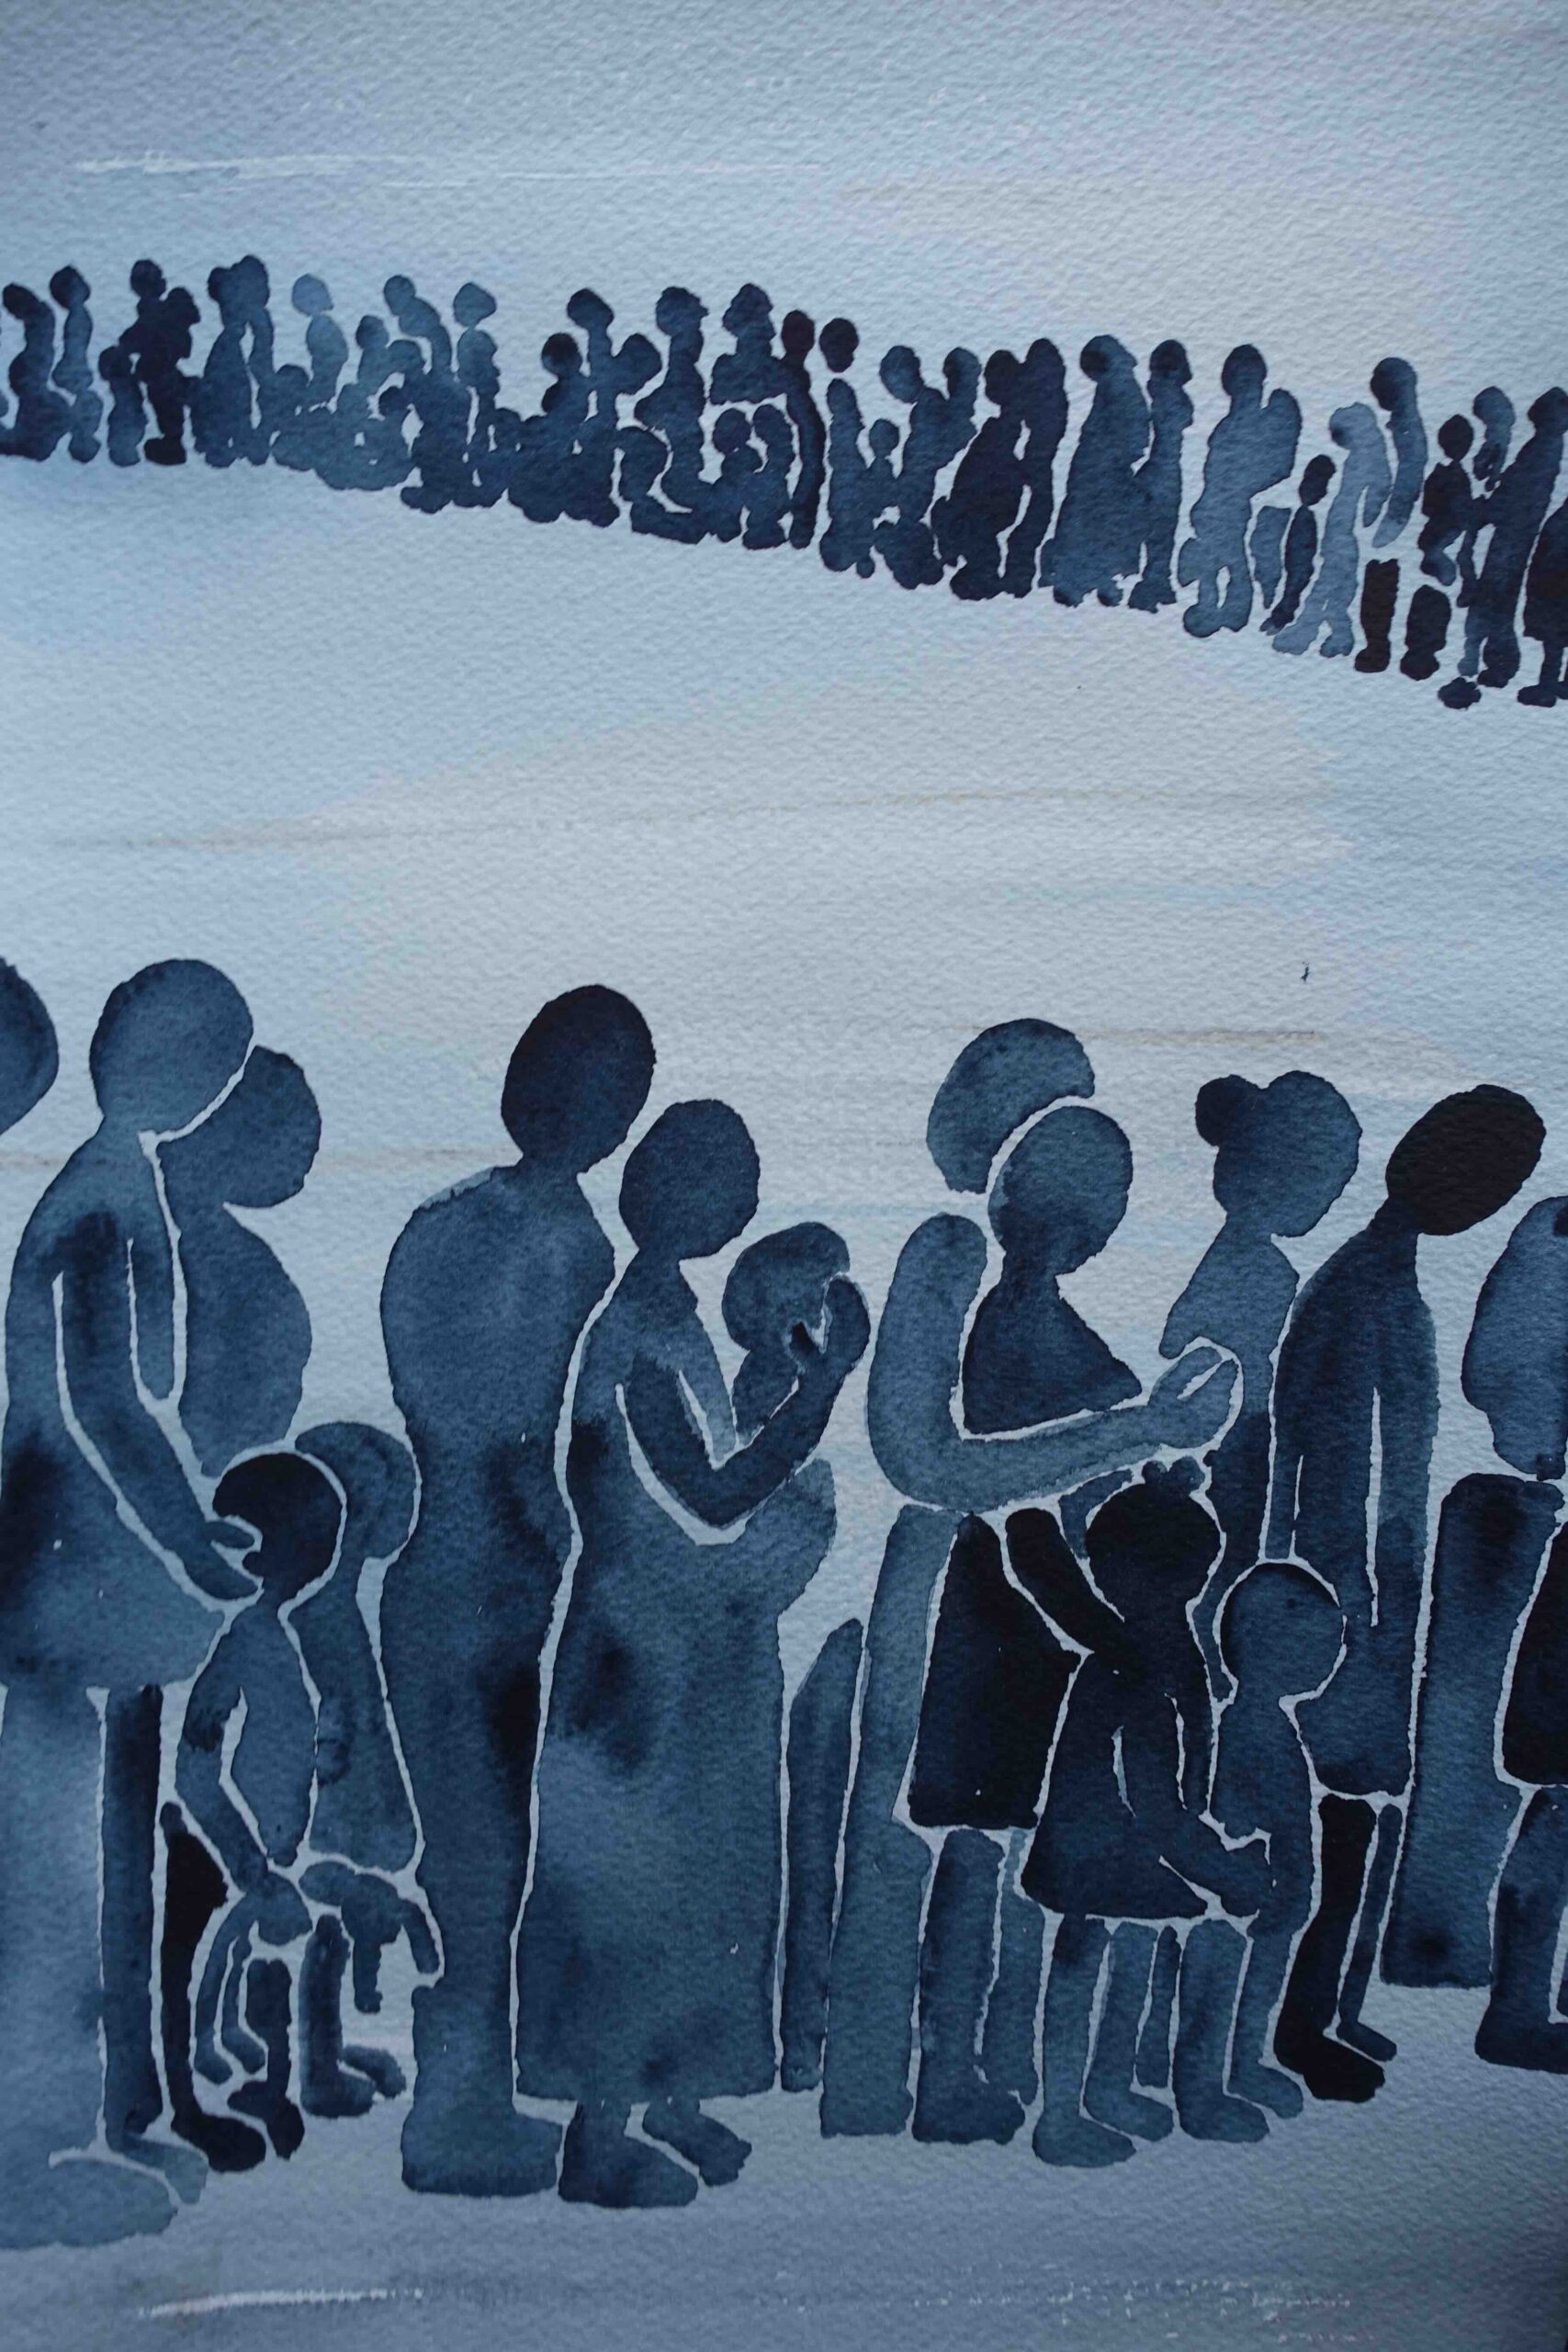
Jag deltar i en utställning med temat OM FLYKT tillsammans Kajsa Haglund, Roine Jansson, Klas Hällerstrand, Noomi Engström, Hayder Hameed, Awni Mohamed, Petal Joan Roberts och Tina Tombrock i Adelante (www.adelanteart) i Galleri 2 Uppsala konstnärsklubb, Sysslomansgatan 1 Uppsala, 7 – 22 mars 2026
2025
18 oktober – 16 november 2025
Jag deltog i Akvarellsalongen i Upplands Väsby Konsthall
23 augusti – 7 september
Uppsala konstnärsklubb Sysslomansgatan 1
Jag delog i Uppsala konstnärsklubbens jubileumsutställning
2 – 11 maj 2025 Plåt-Pelles kulturhus
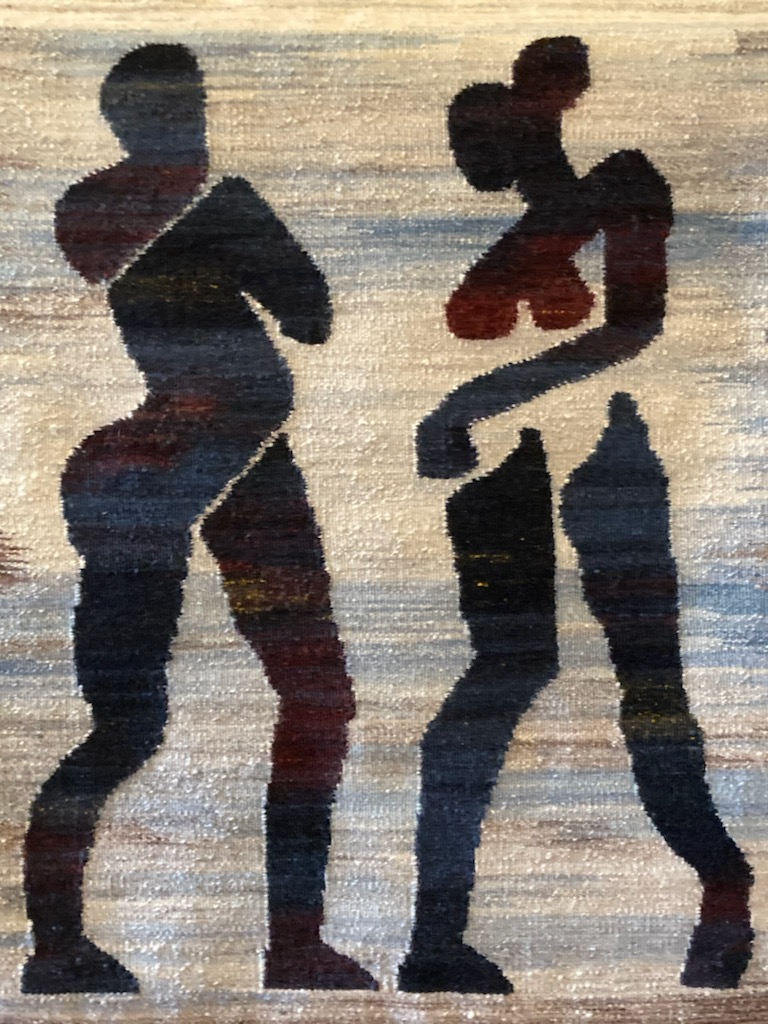
Jag deltog i Vårsalongen i Sigtuna med tre bildvävar.
7 mars – 25 april 2025
Reachings på China Cultural Center
samlingsutställning Västra Trädgårdsgatan 2, Stockholm
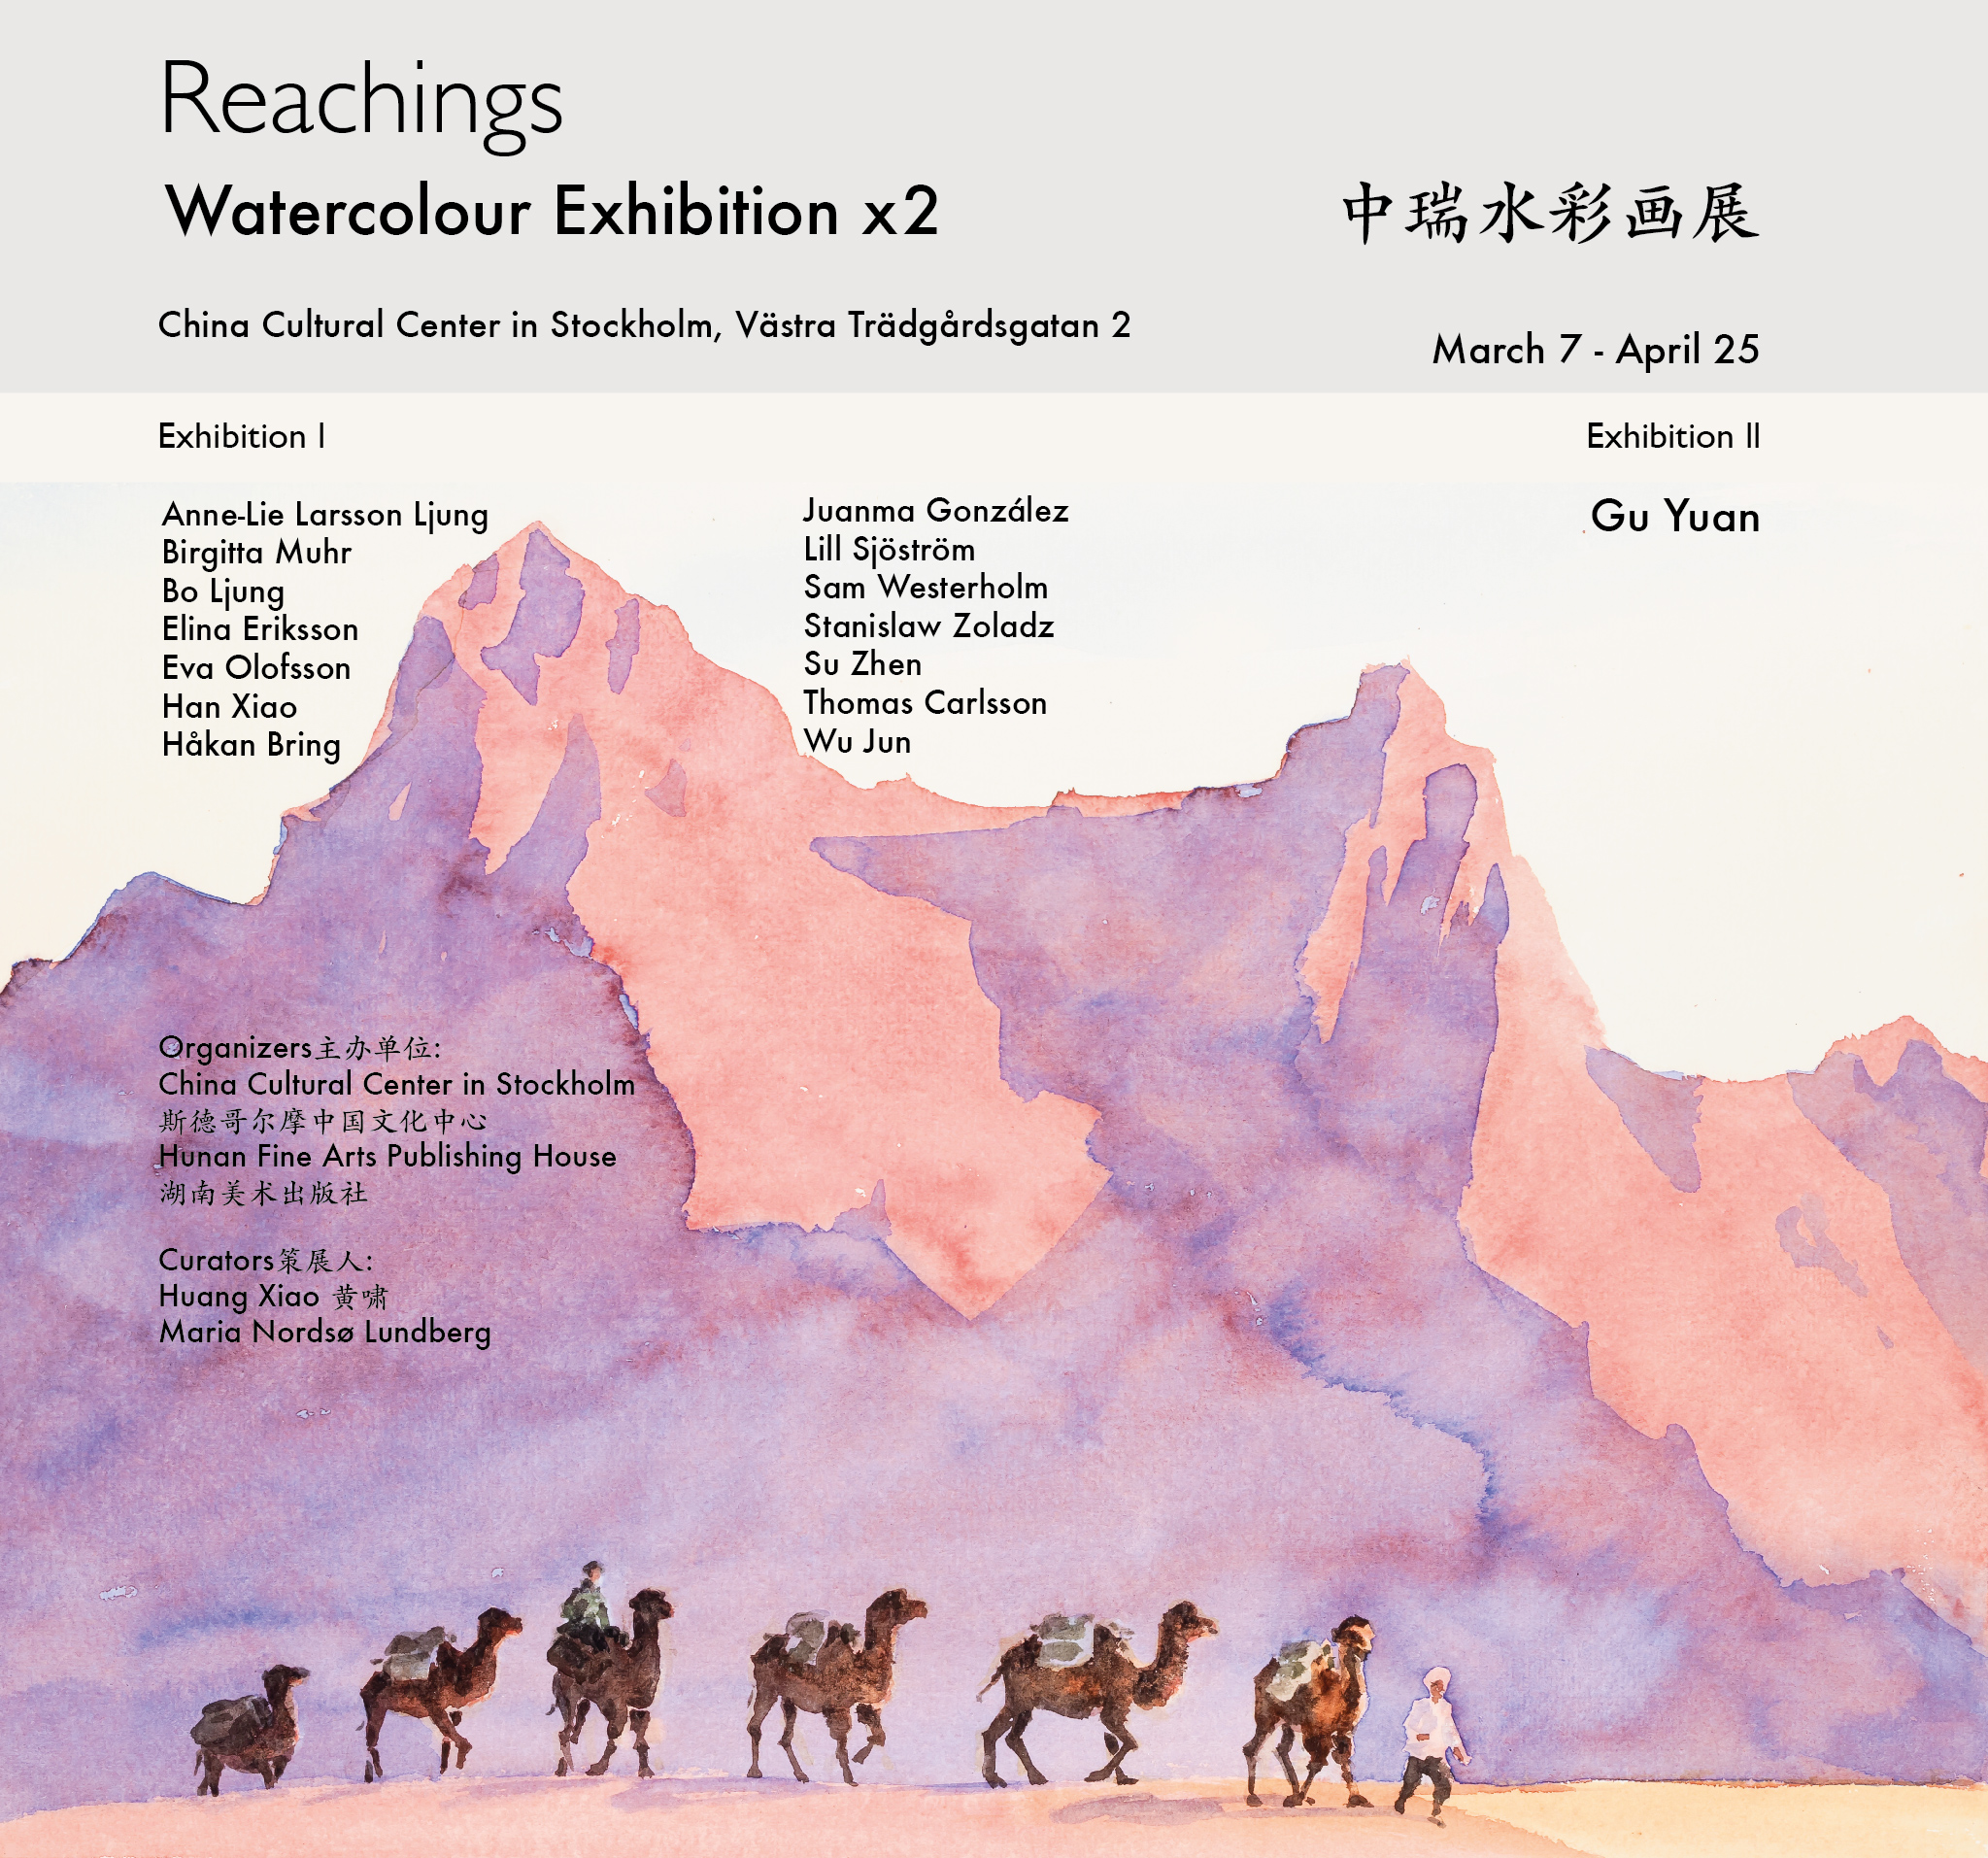
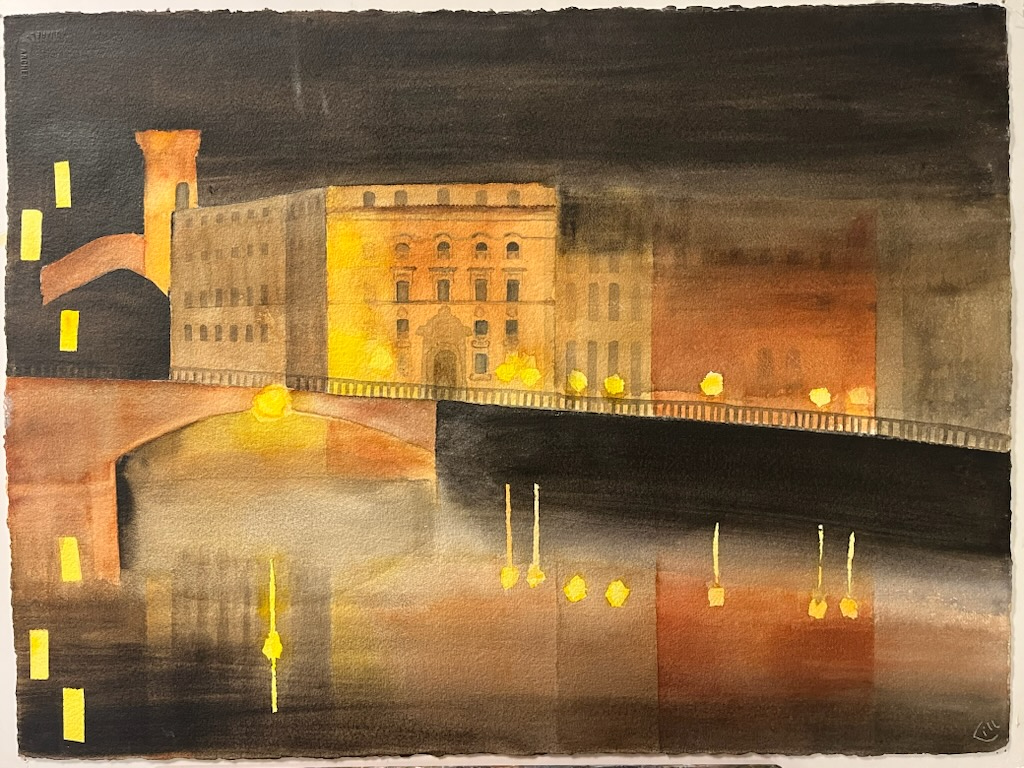
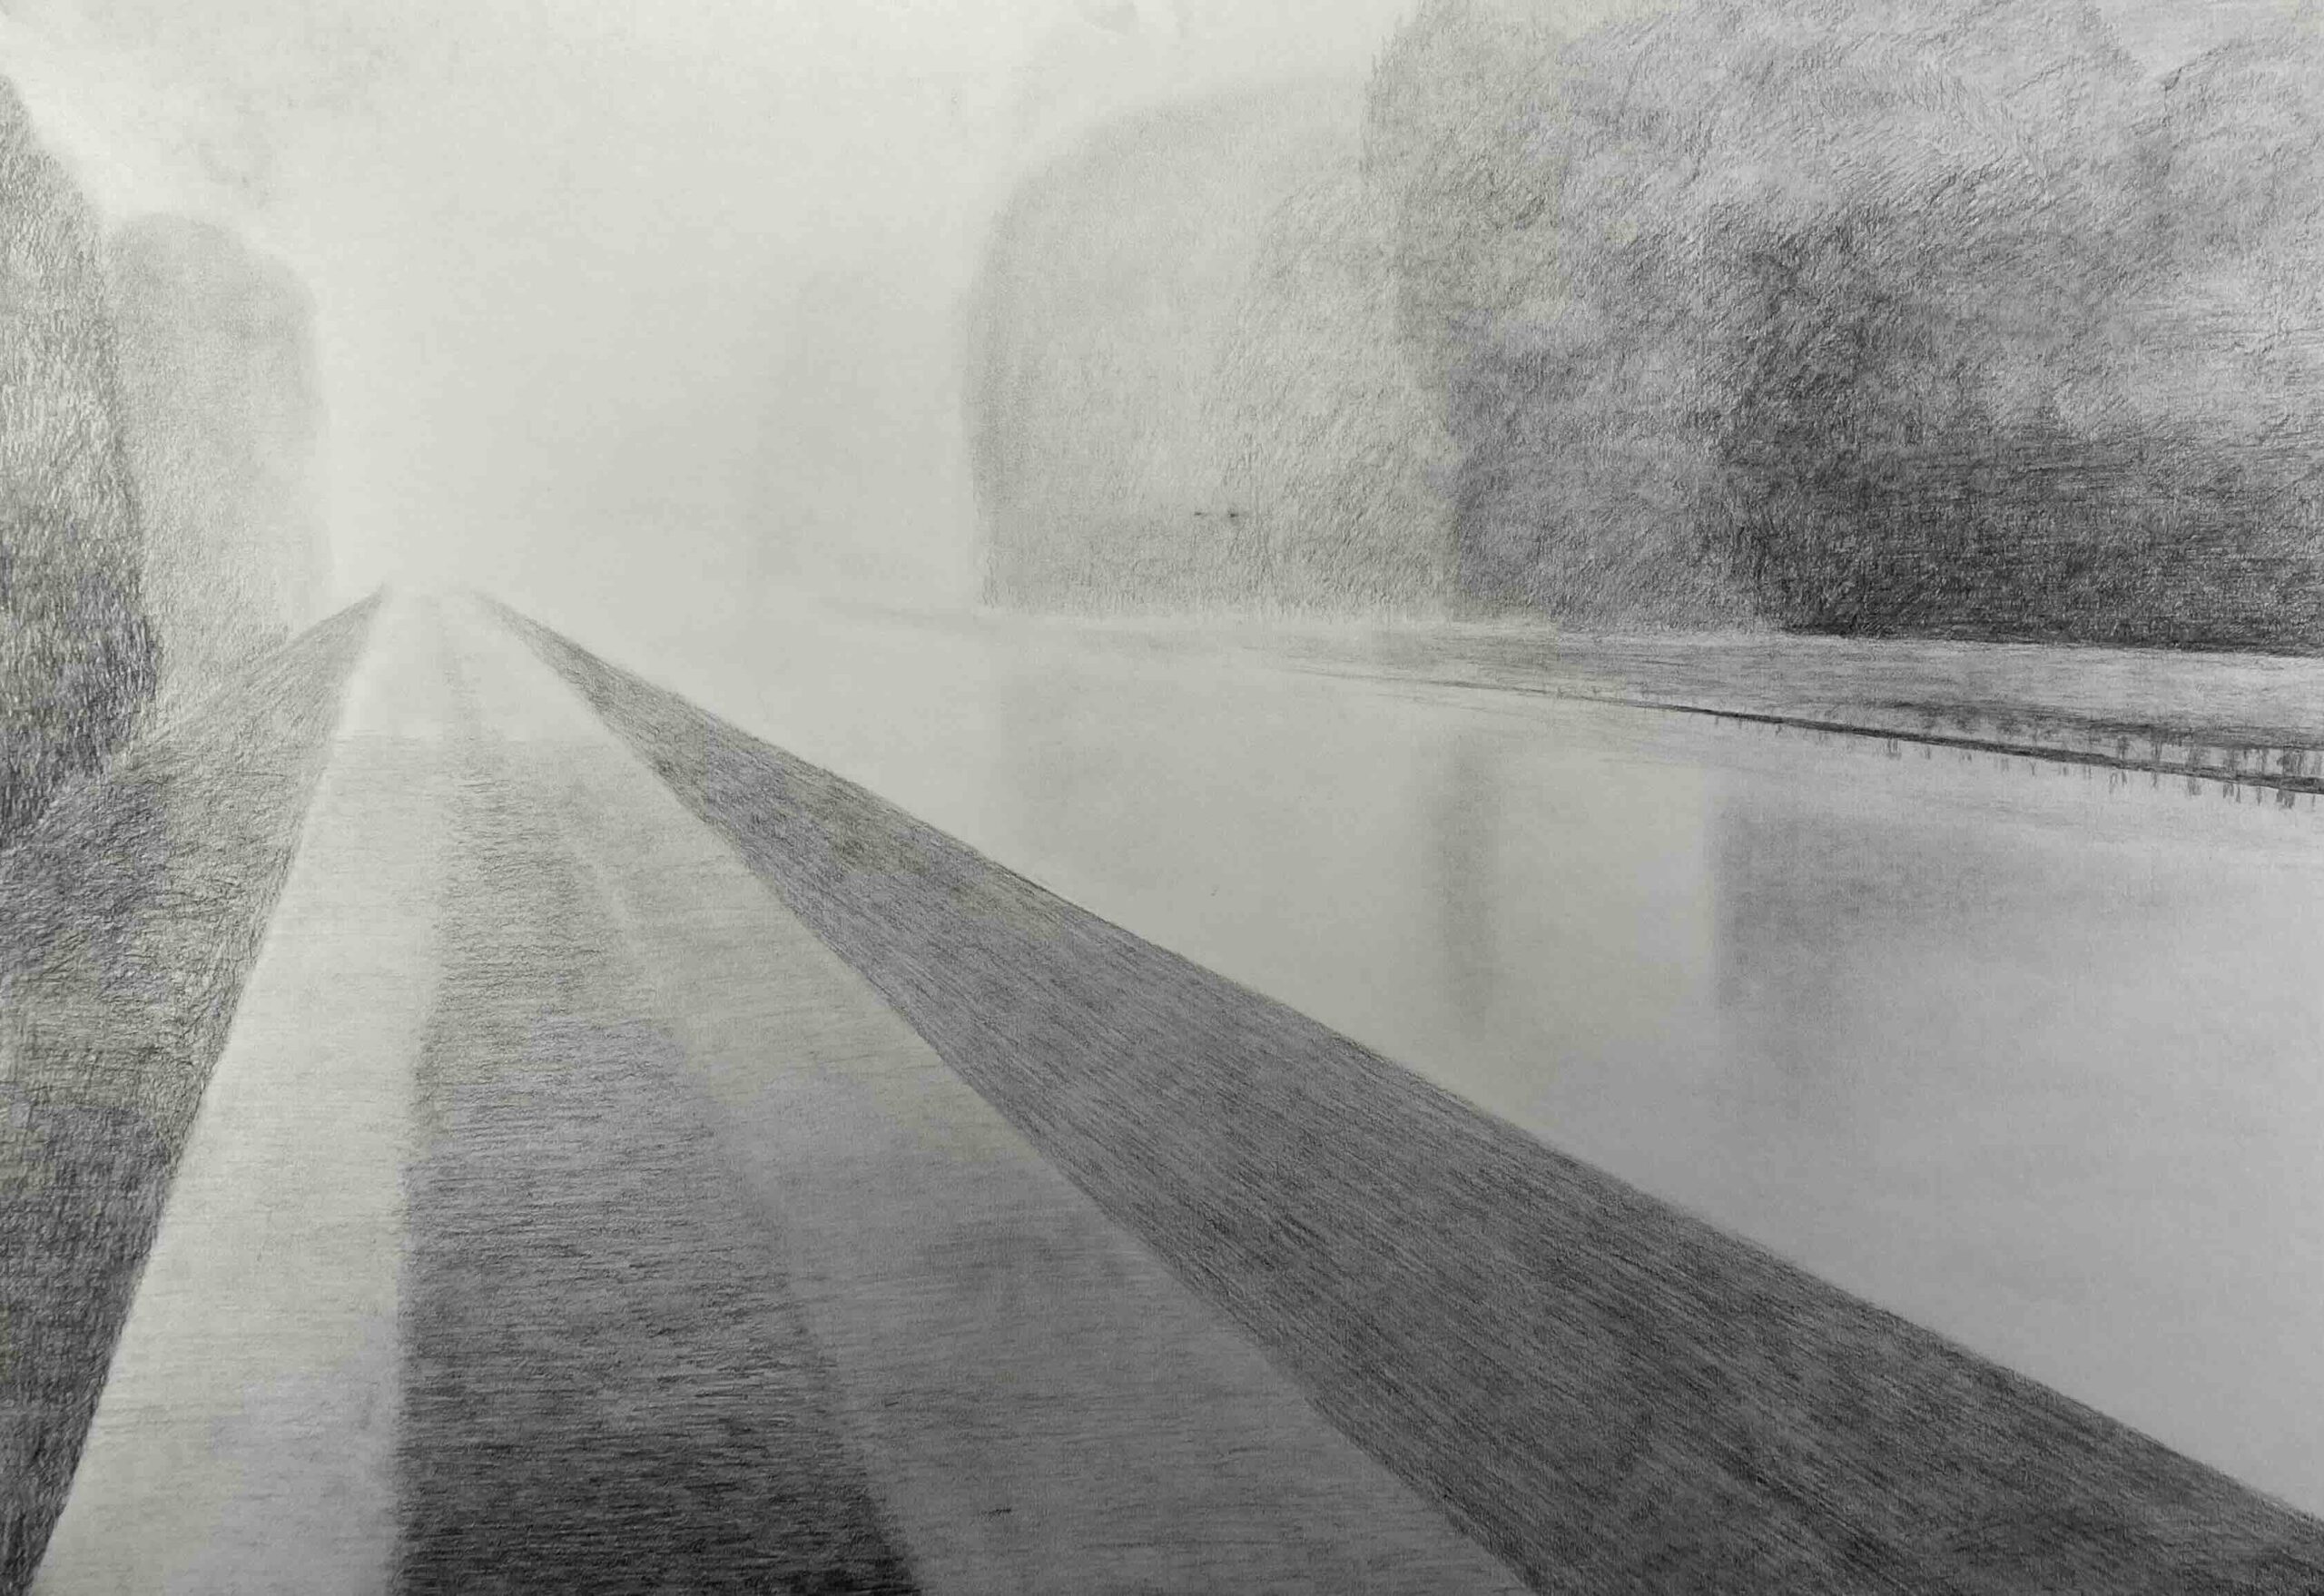
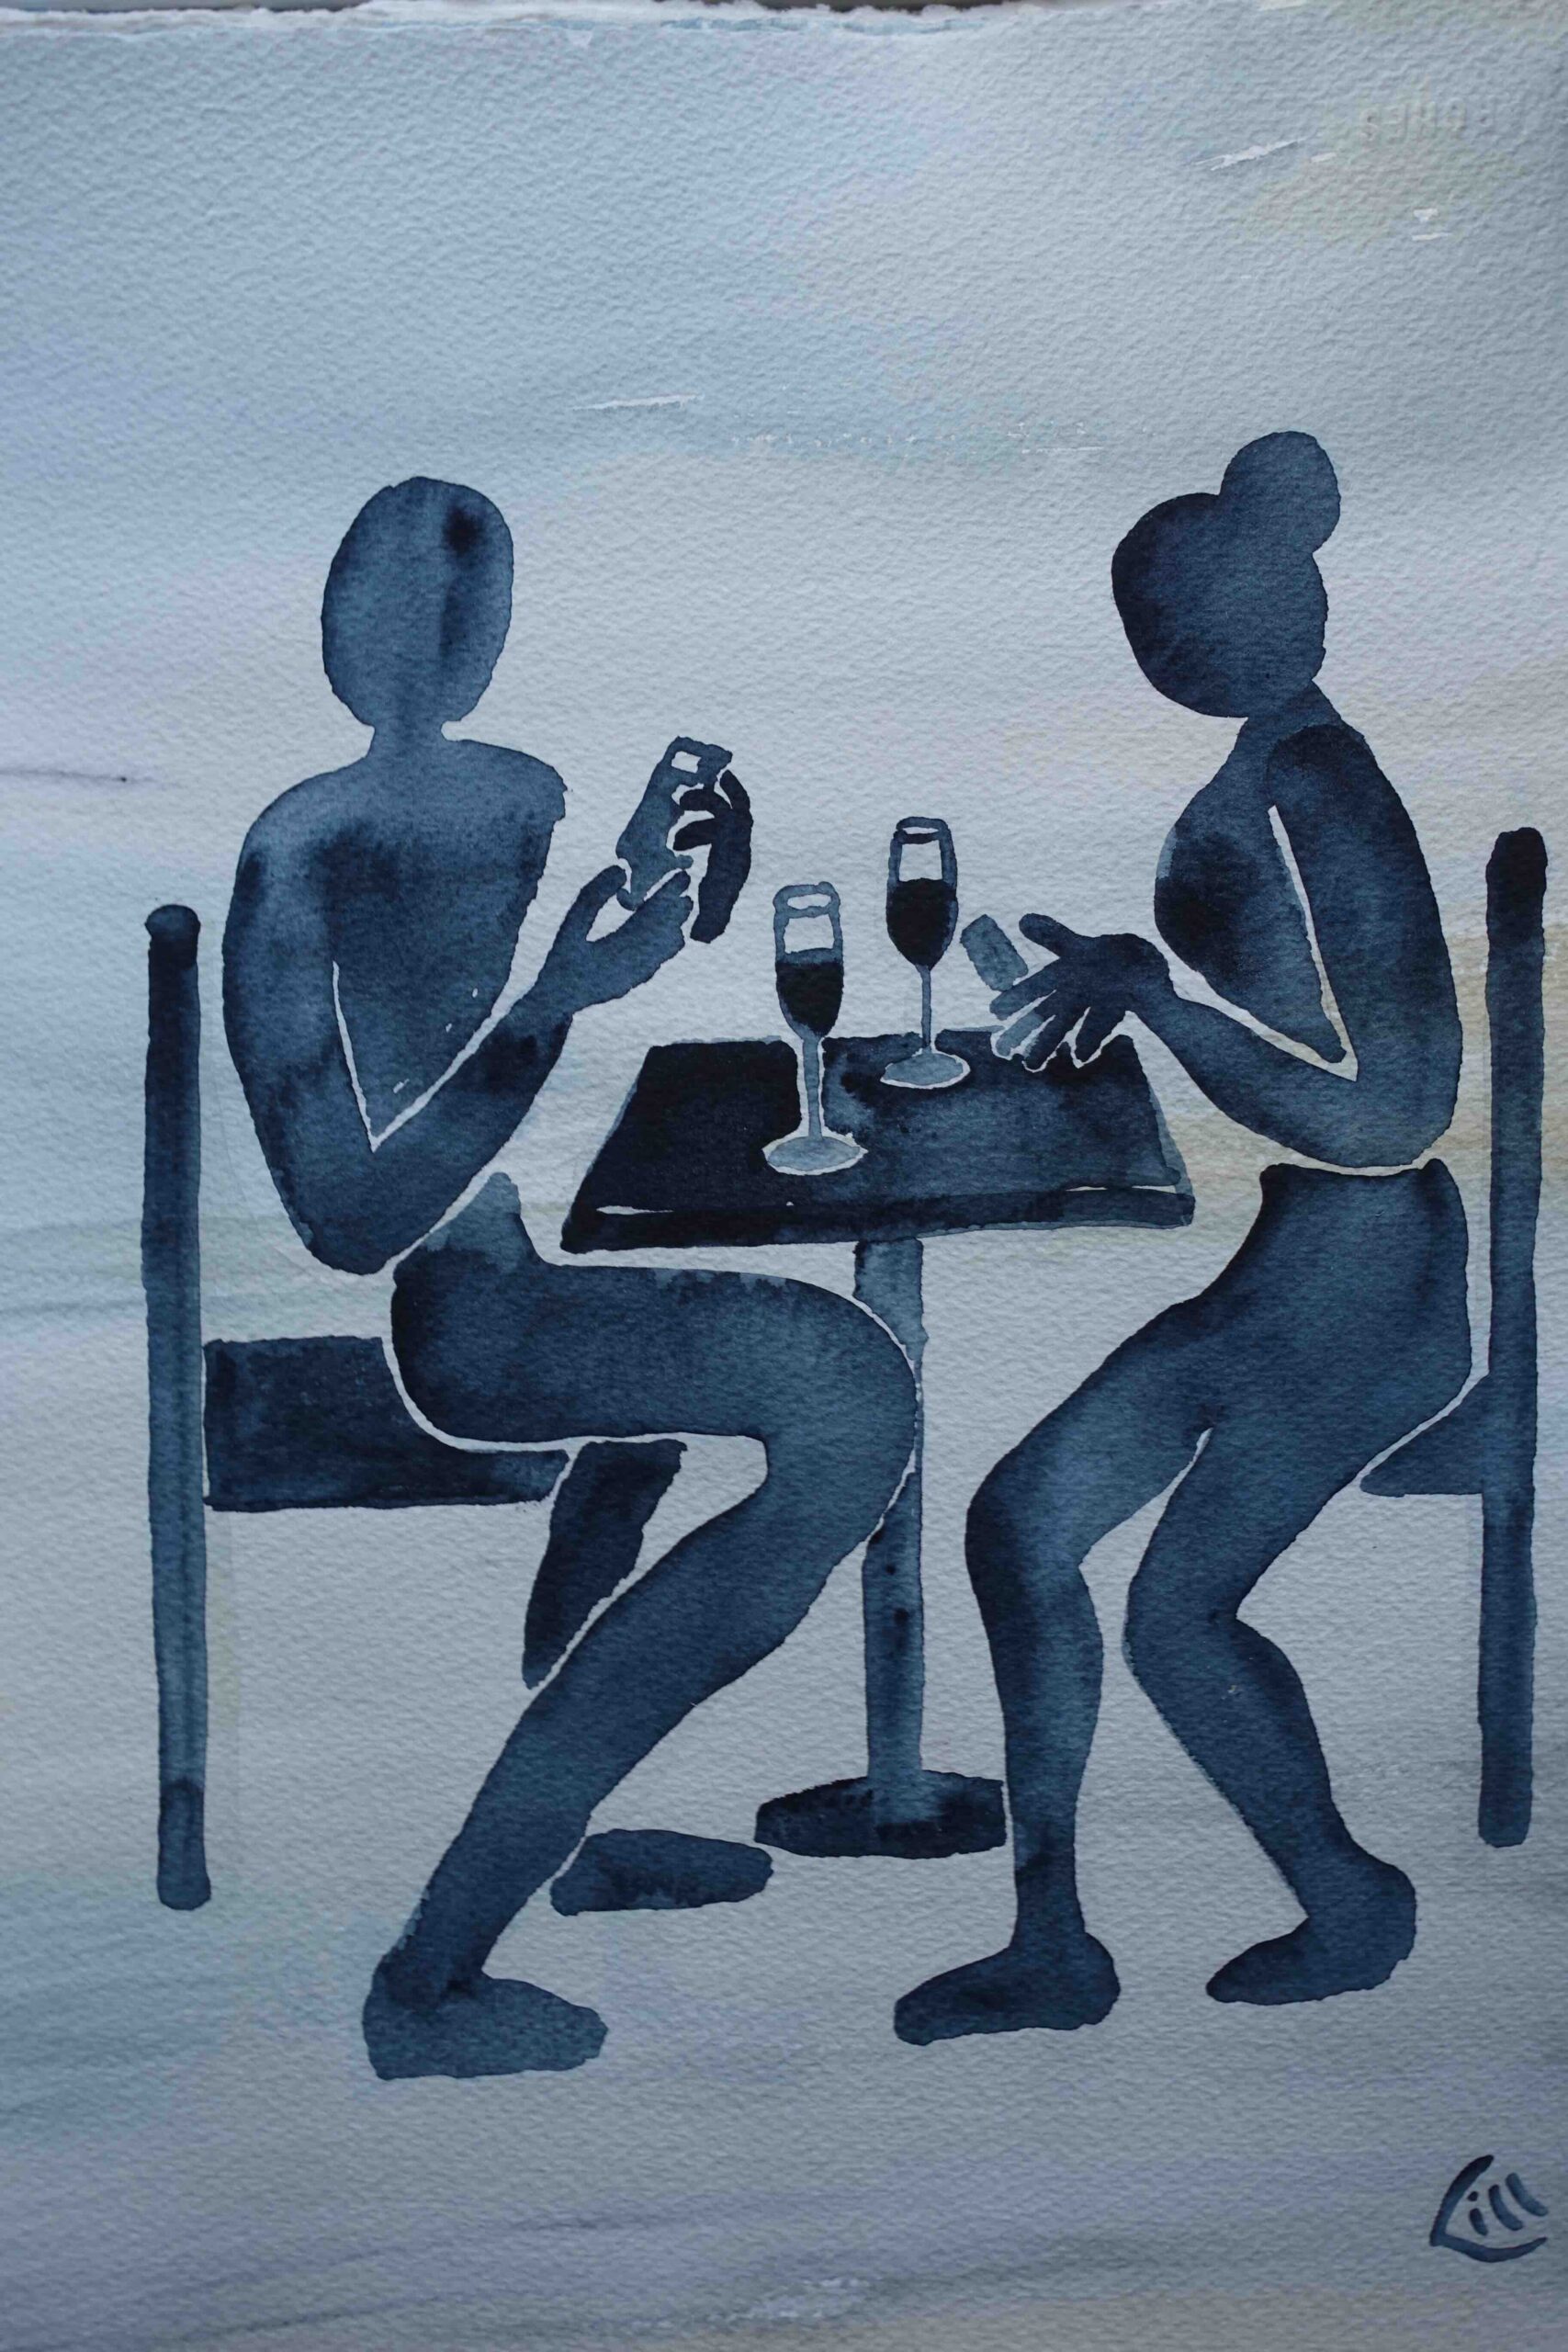
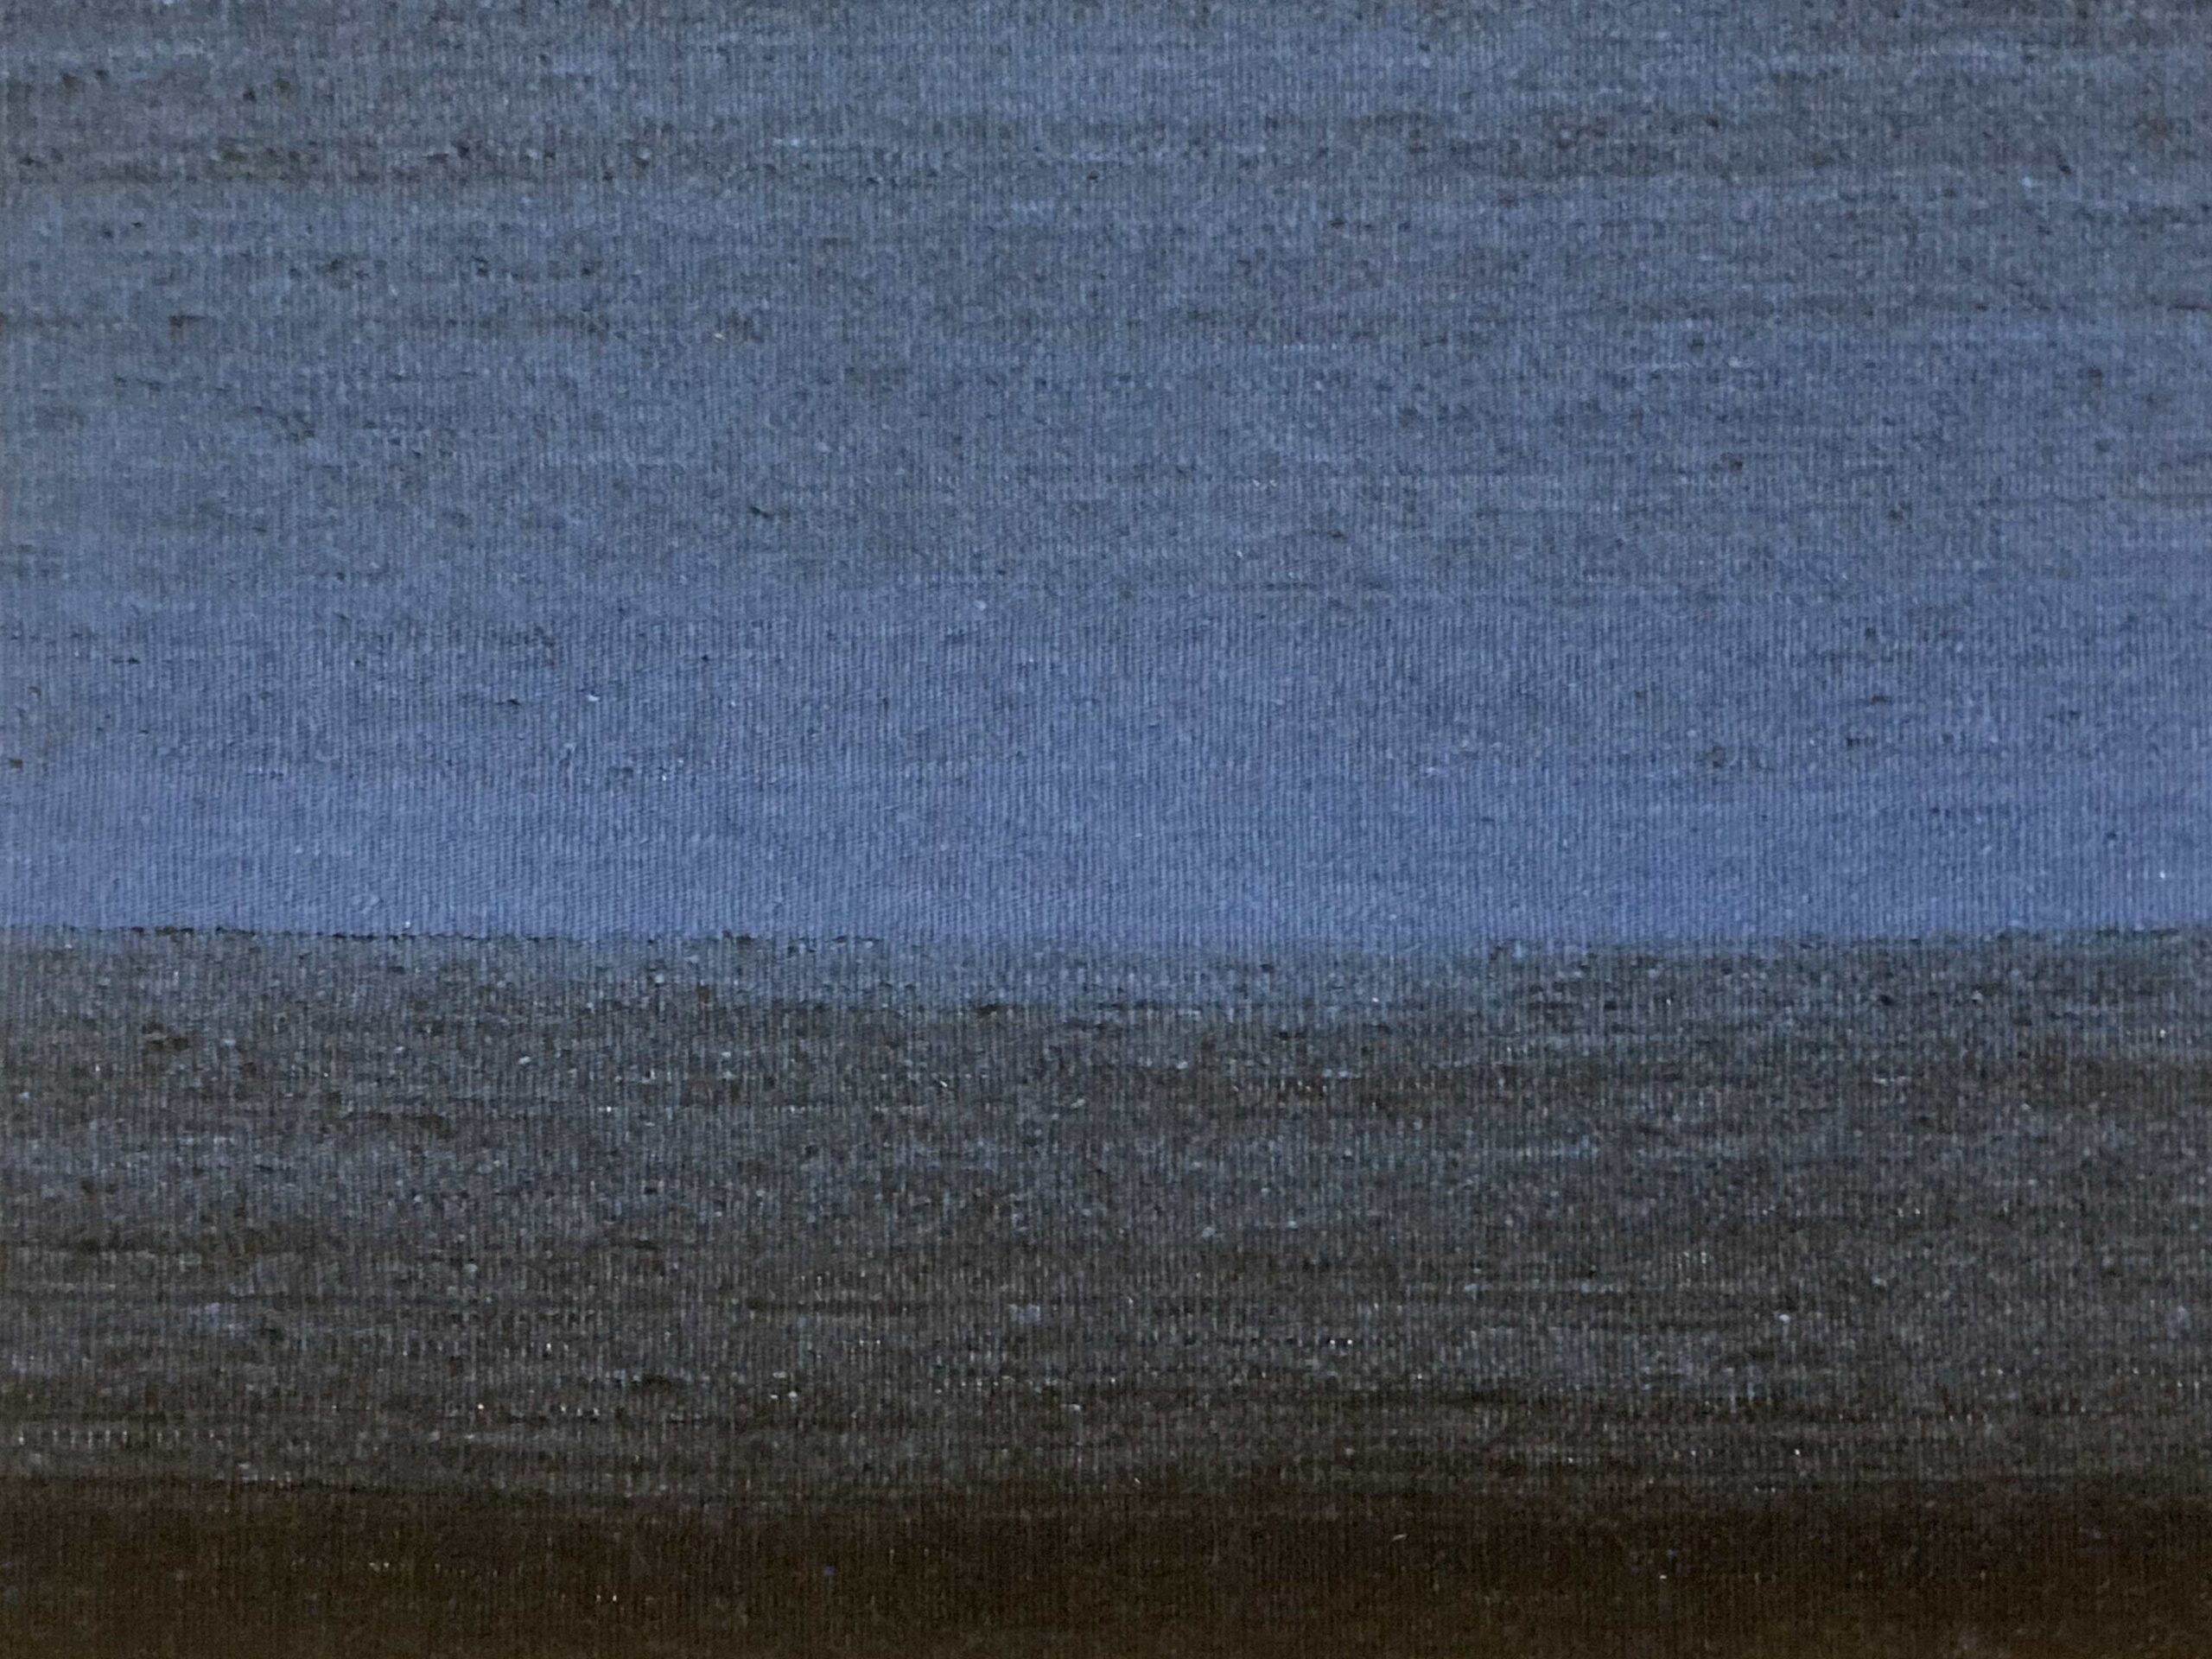
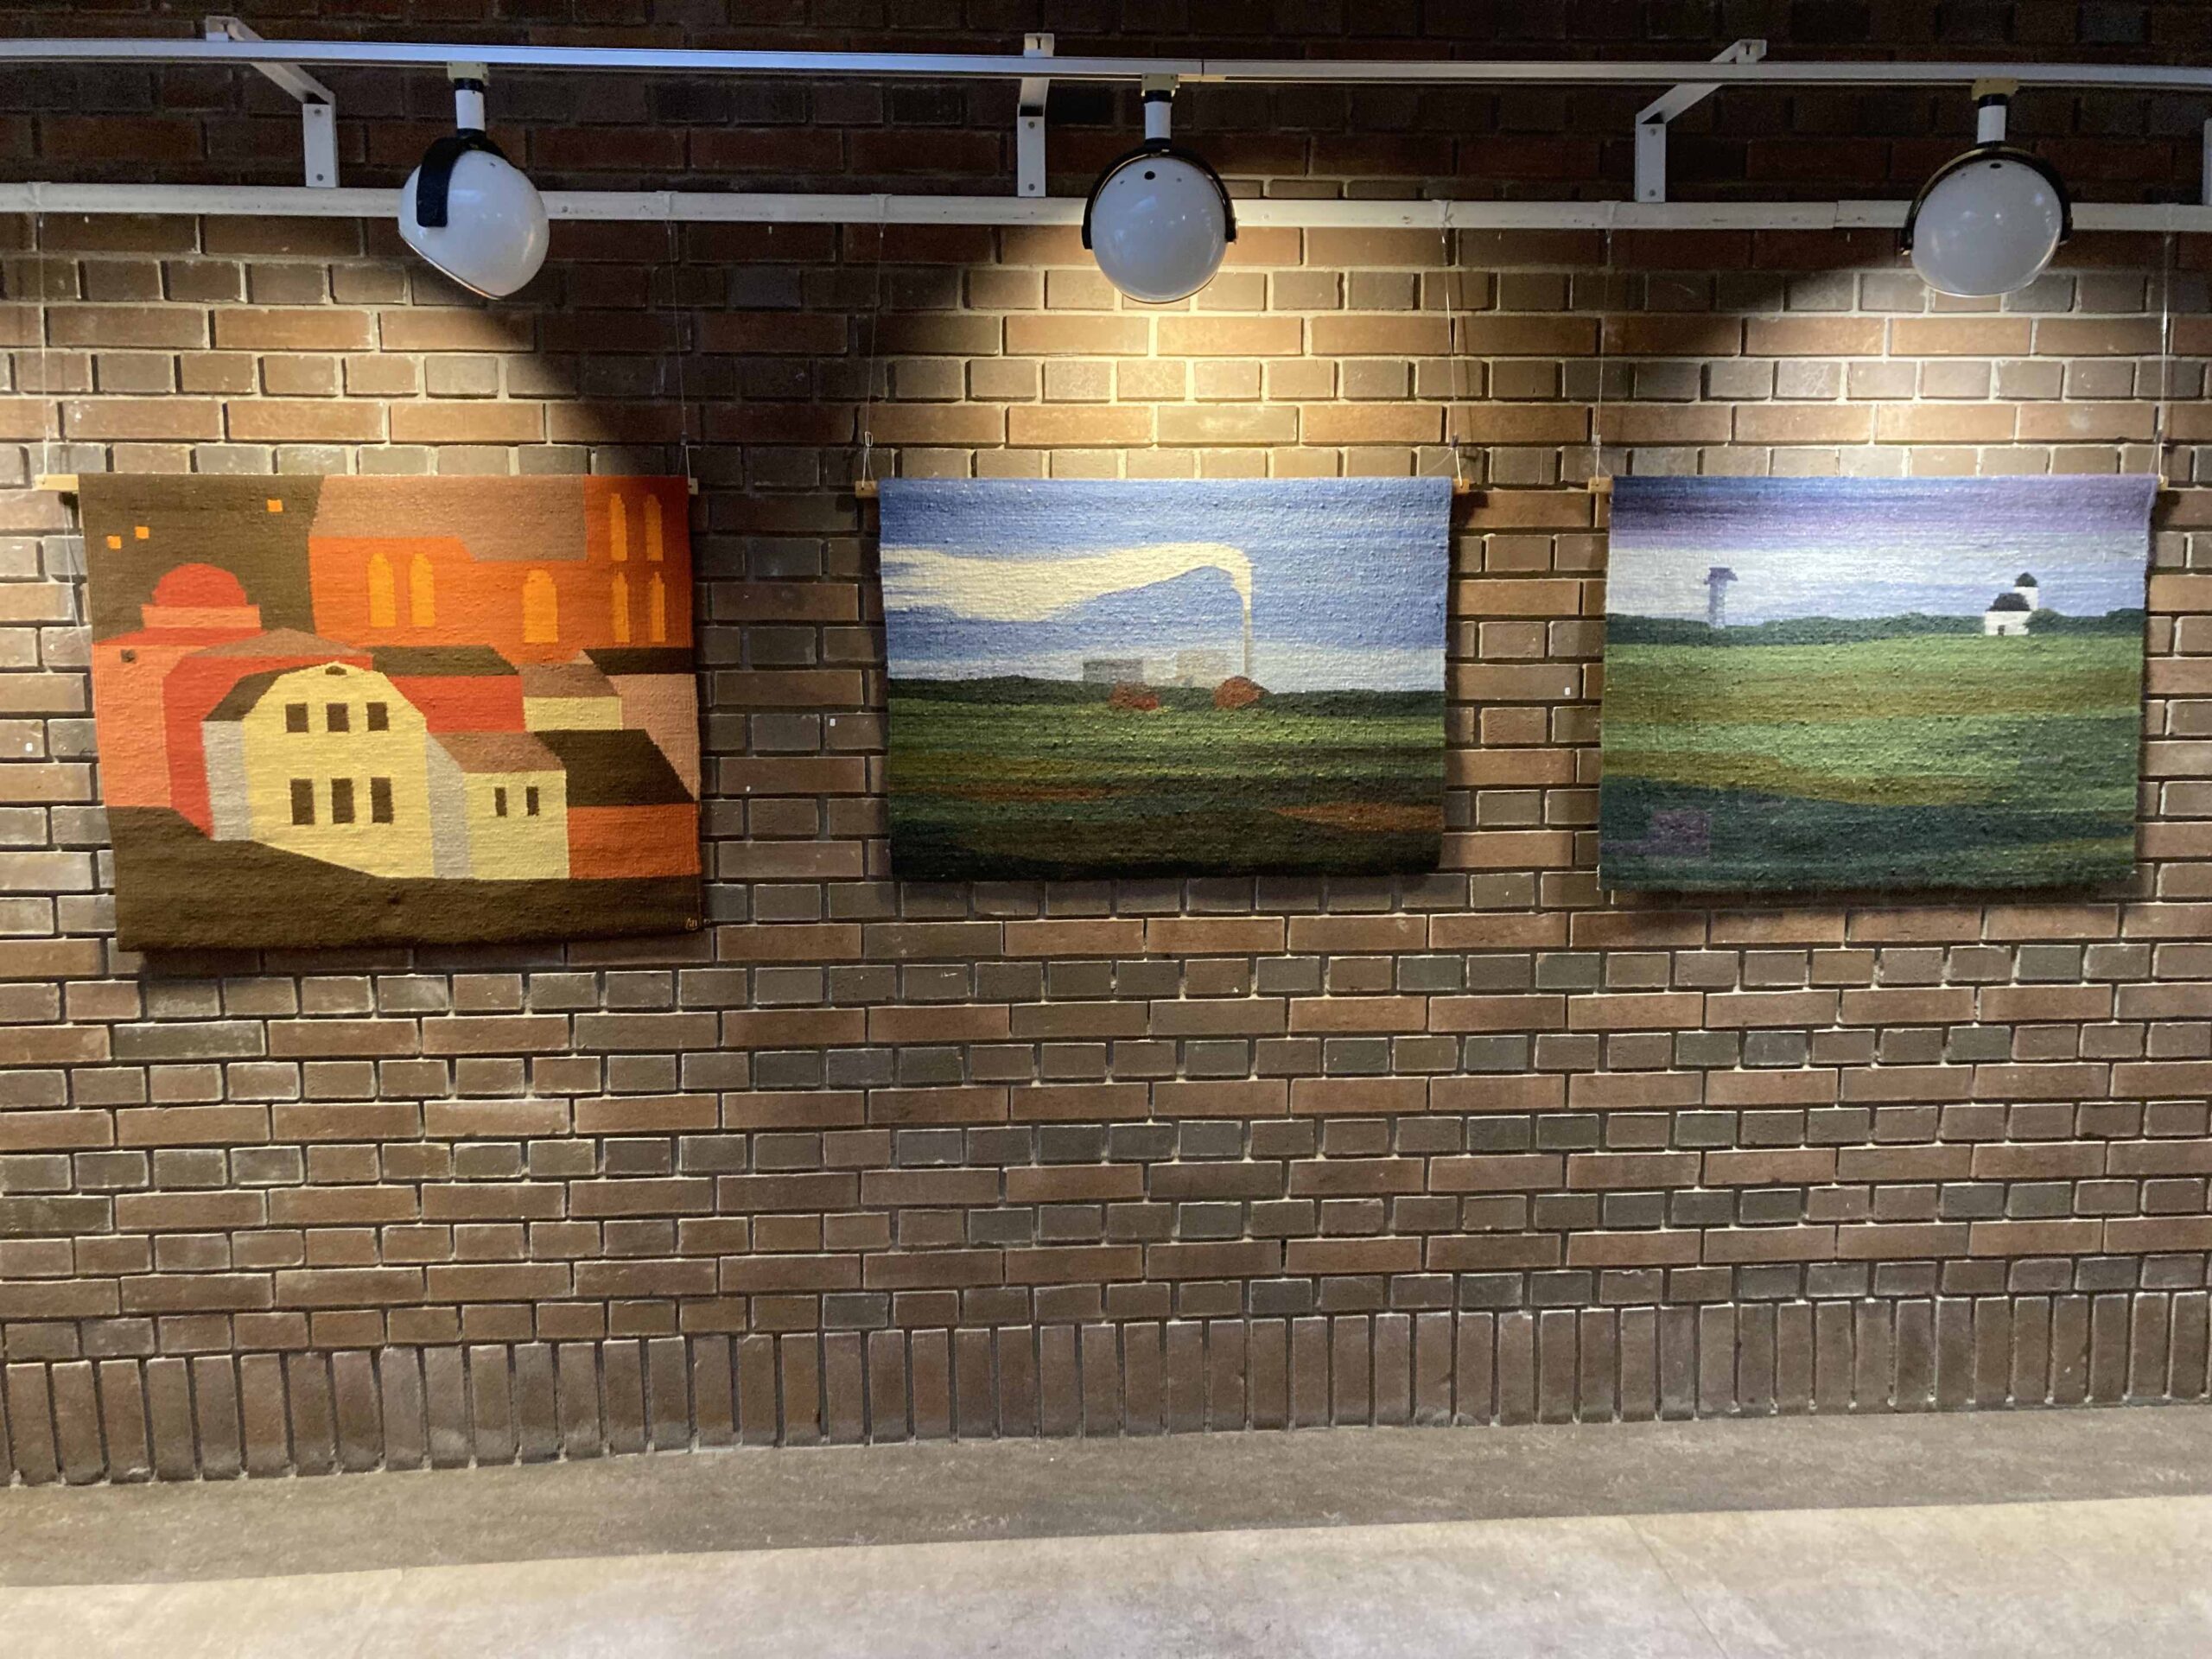
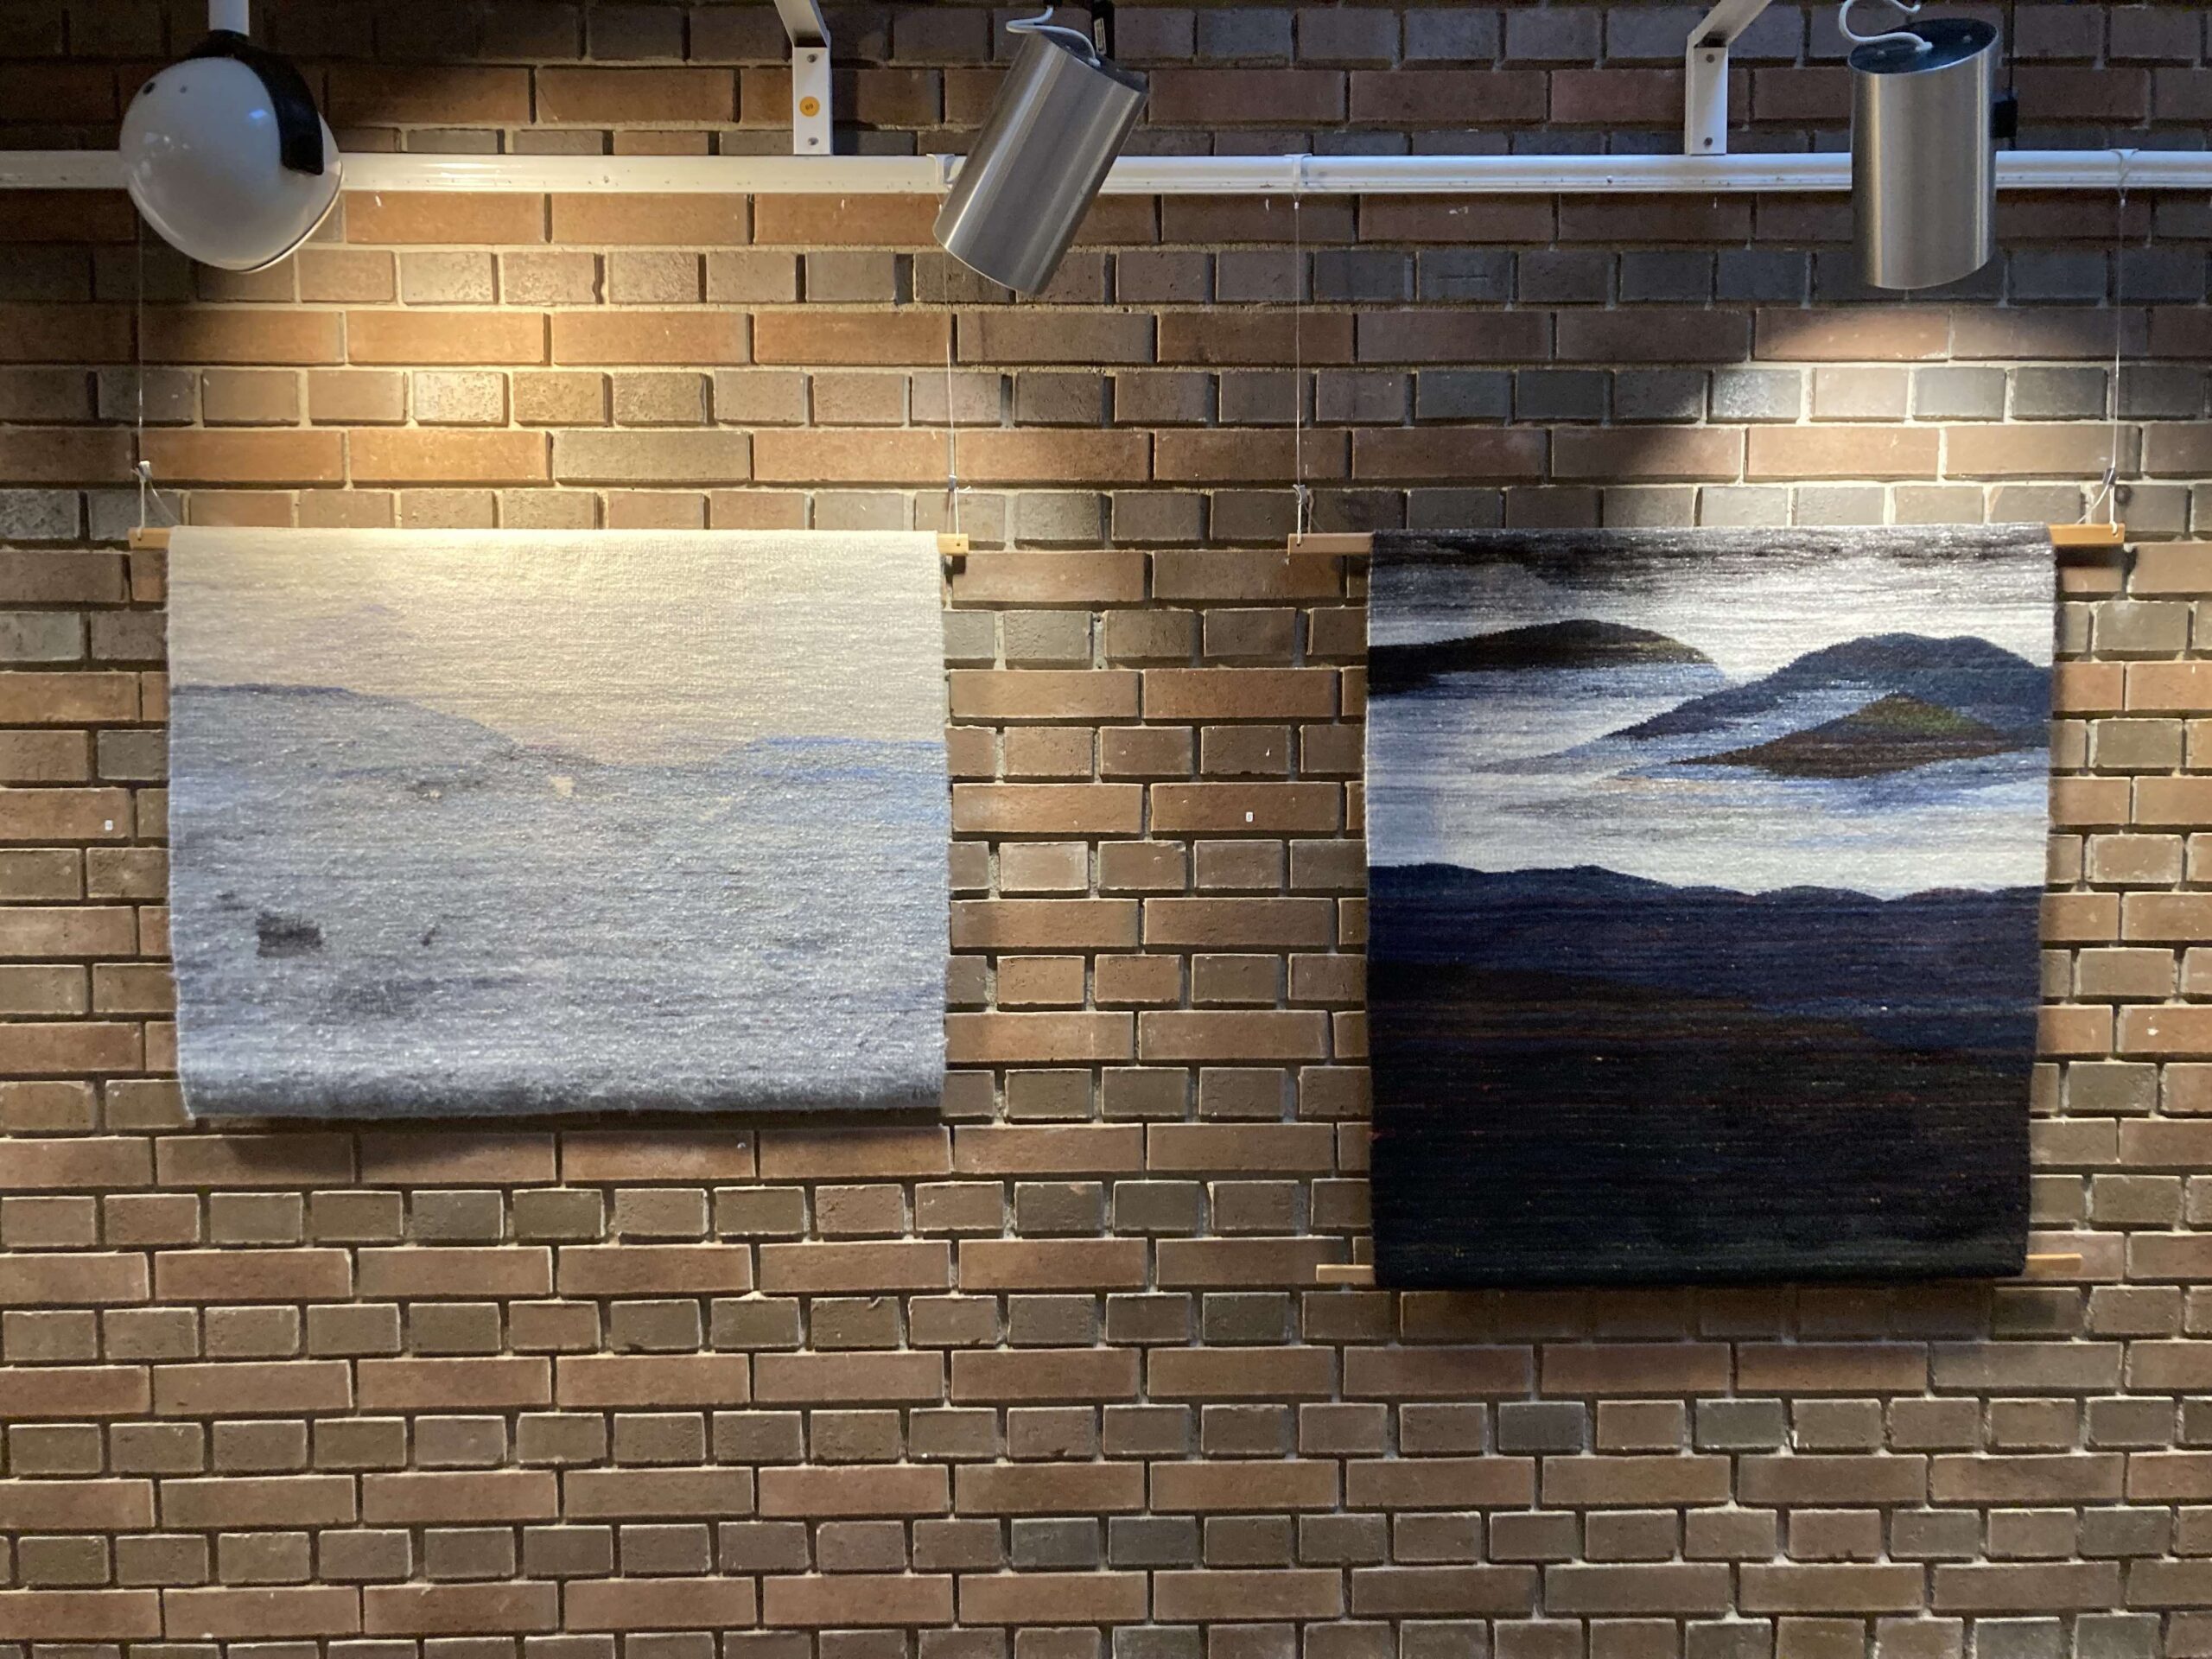
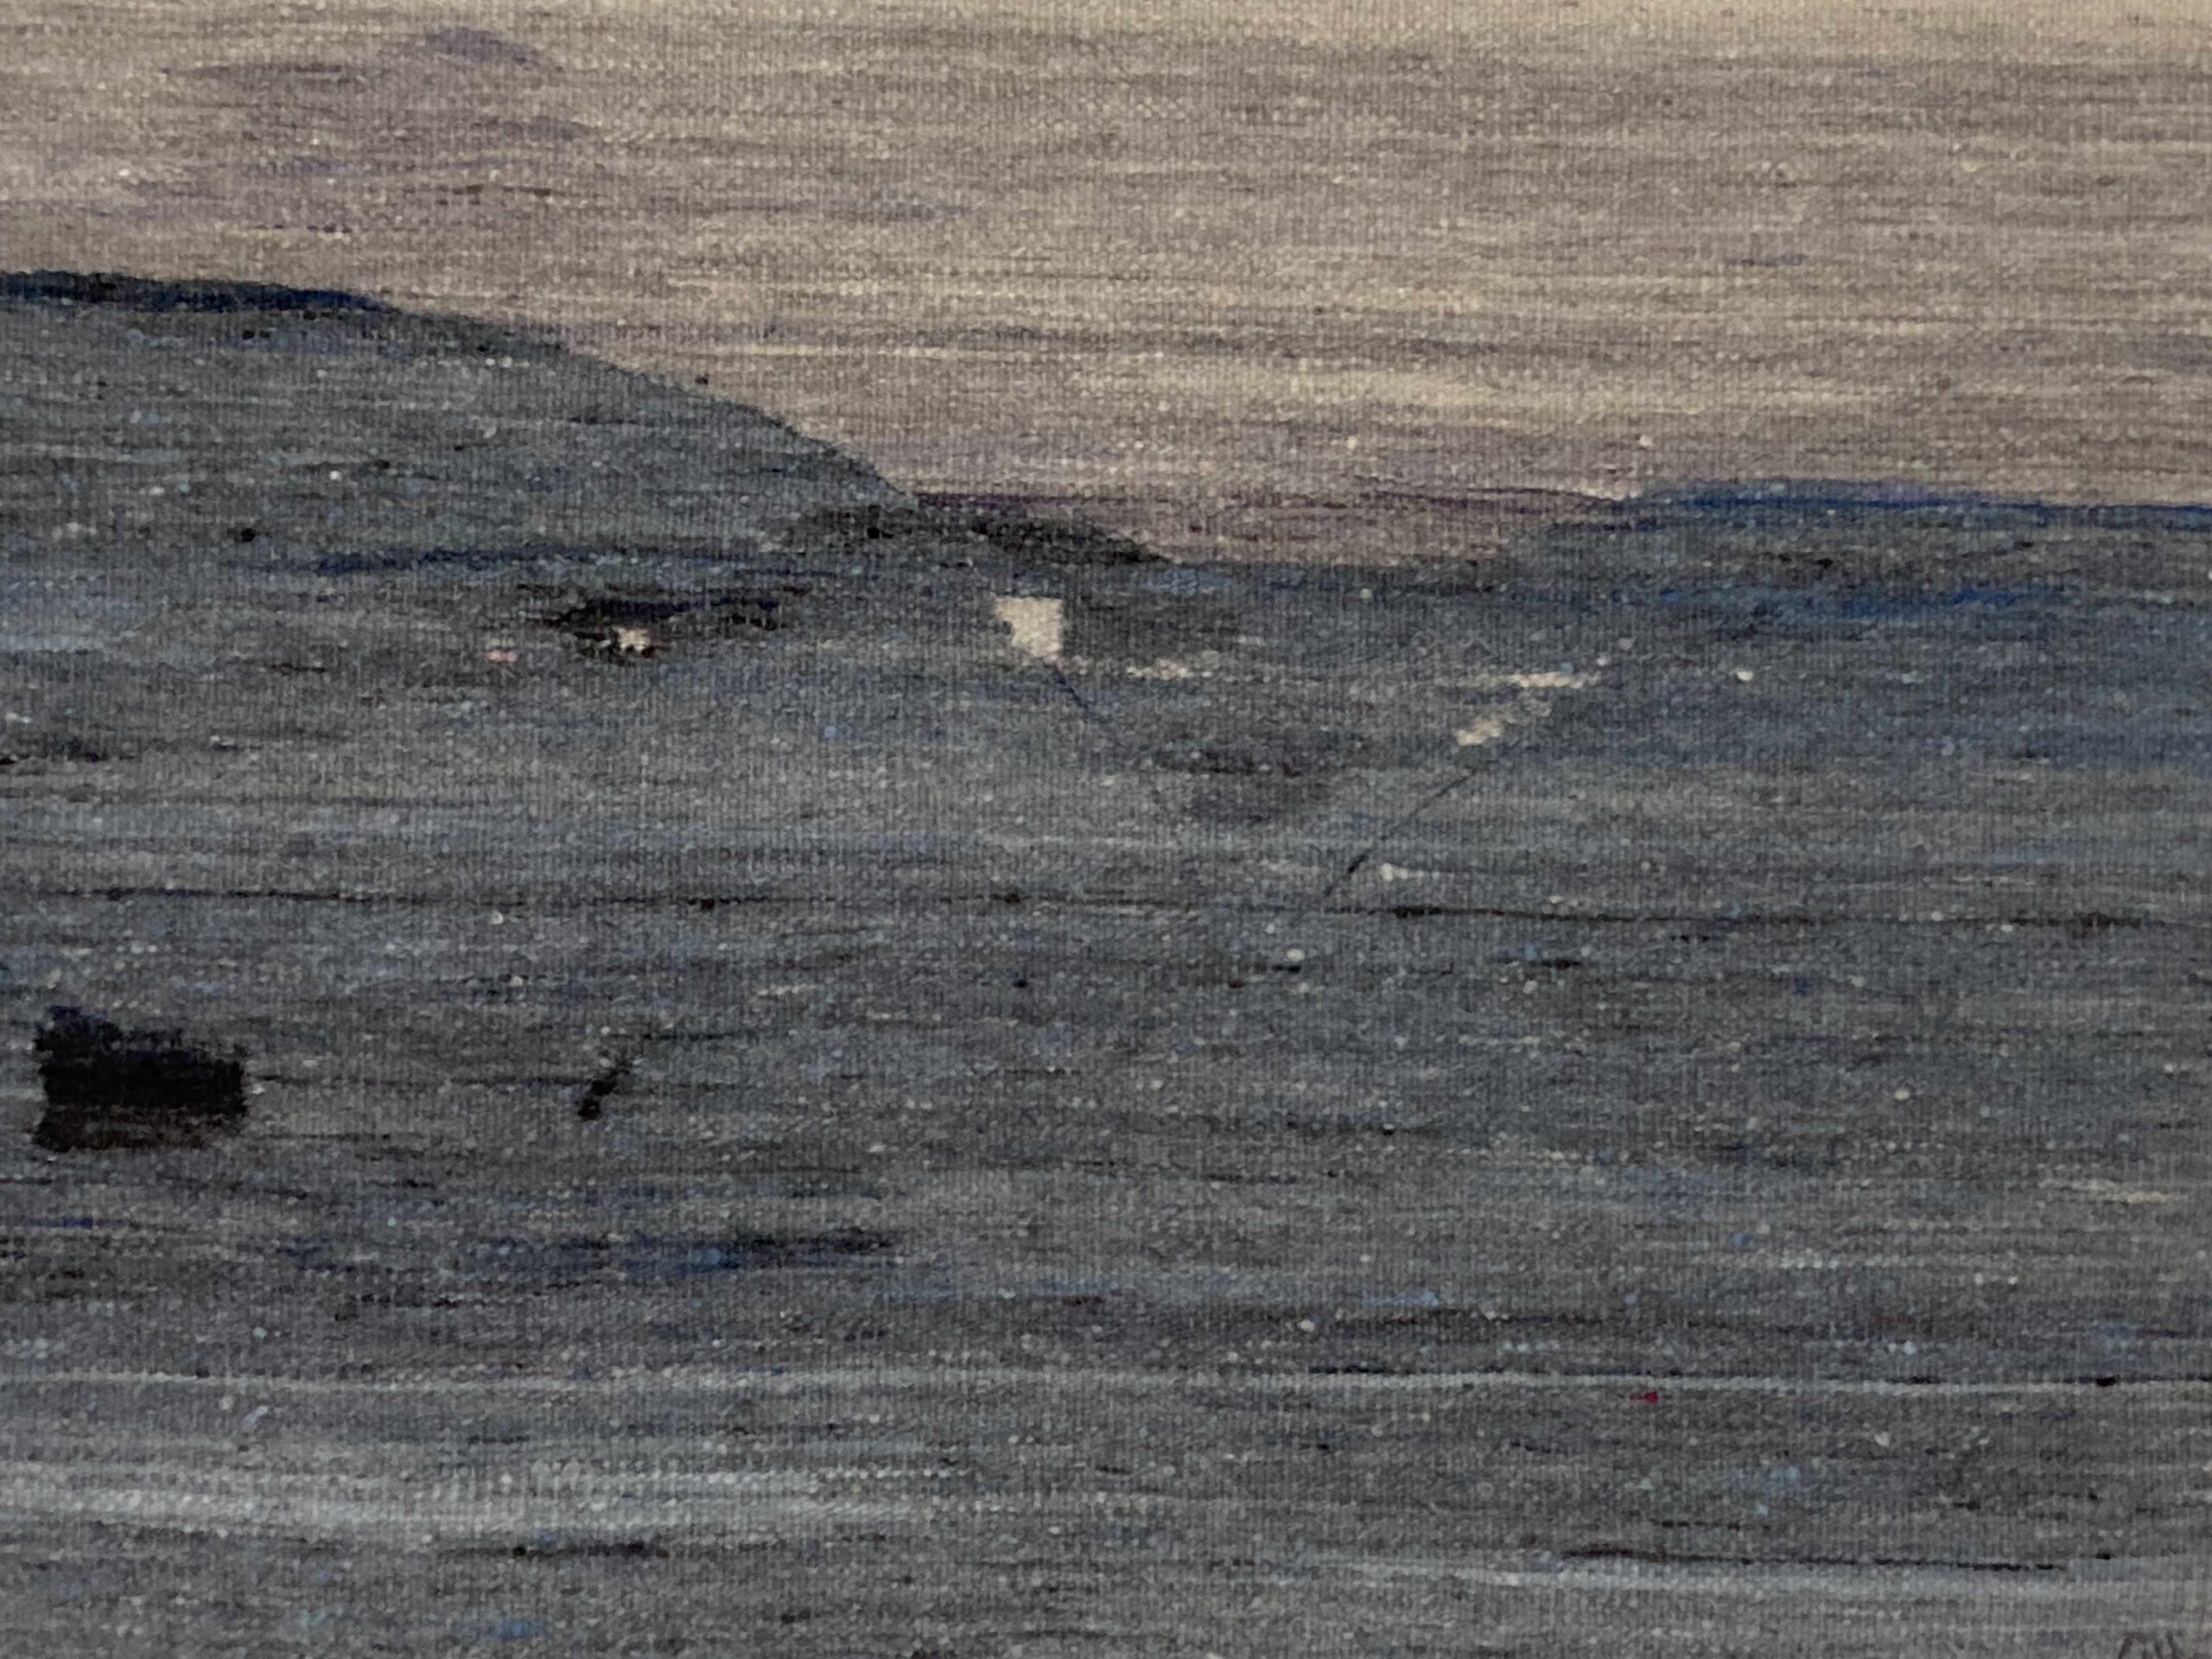
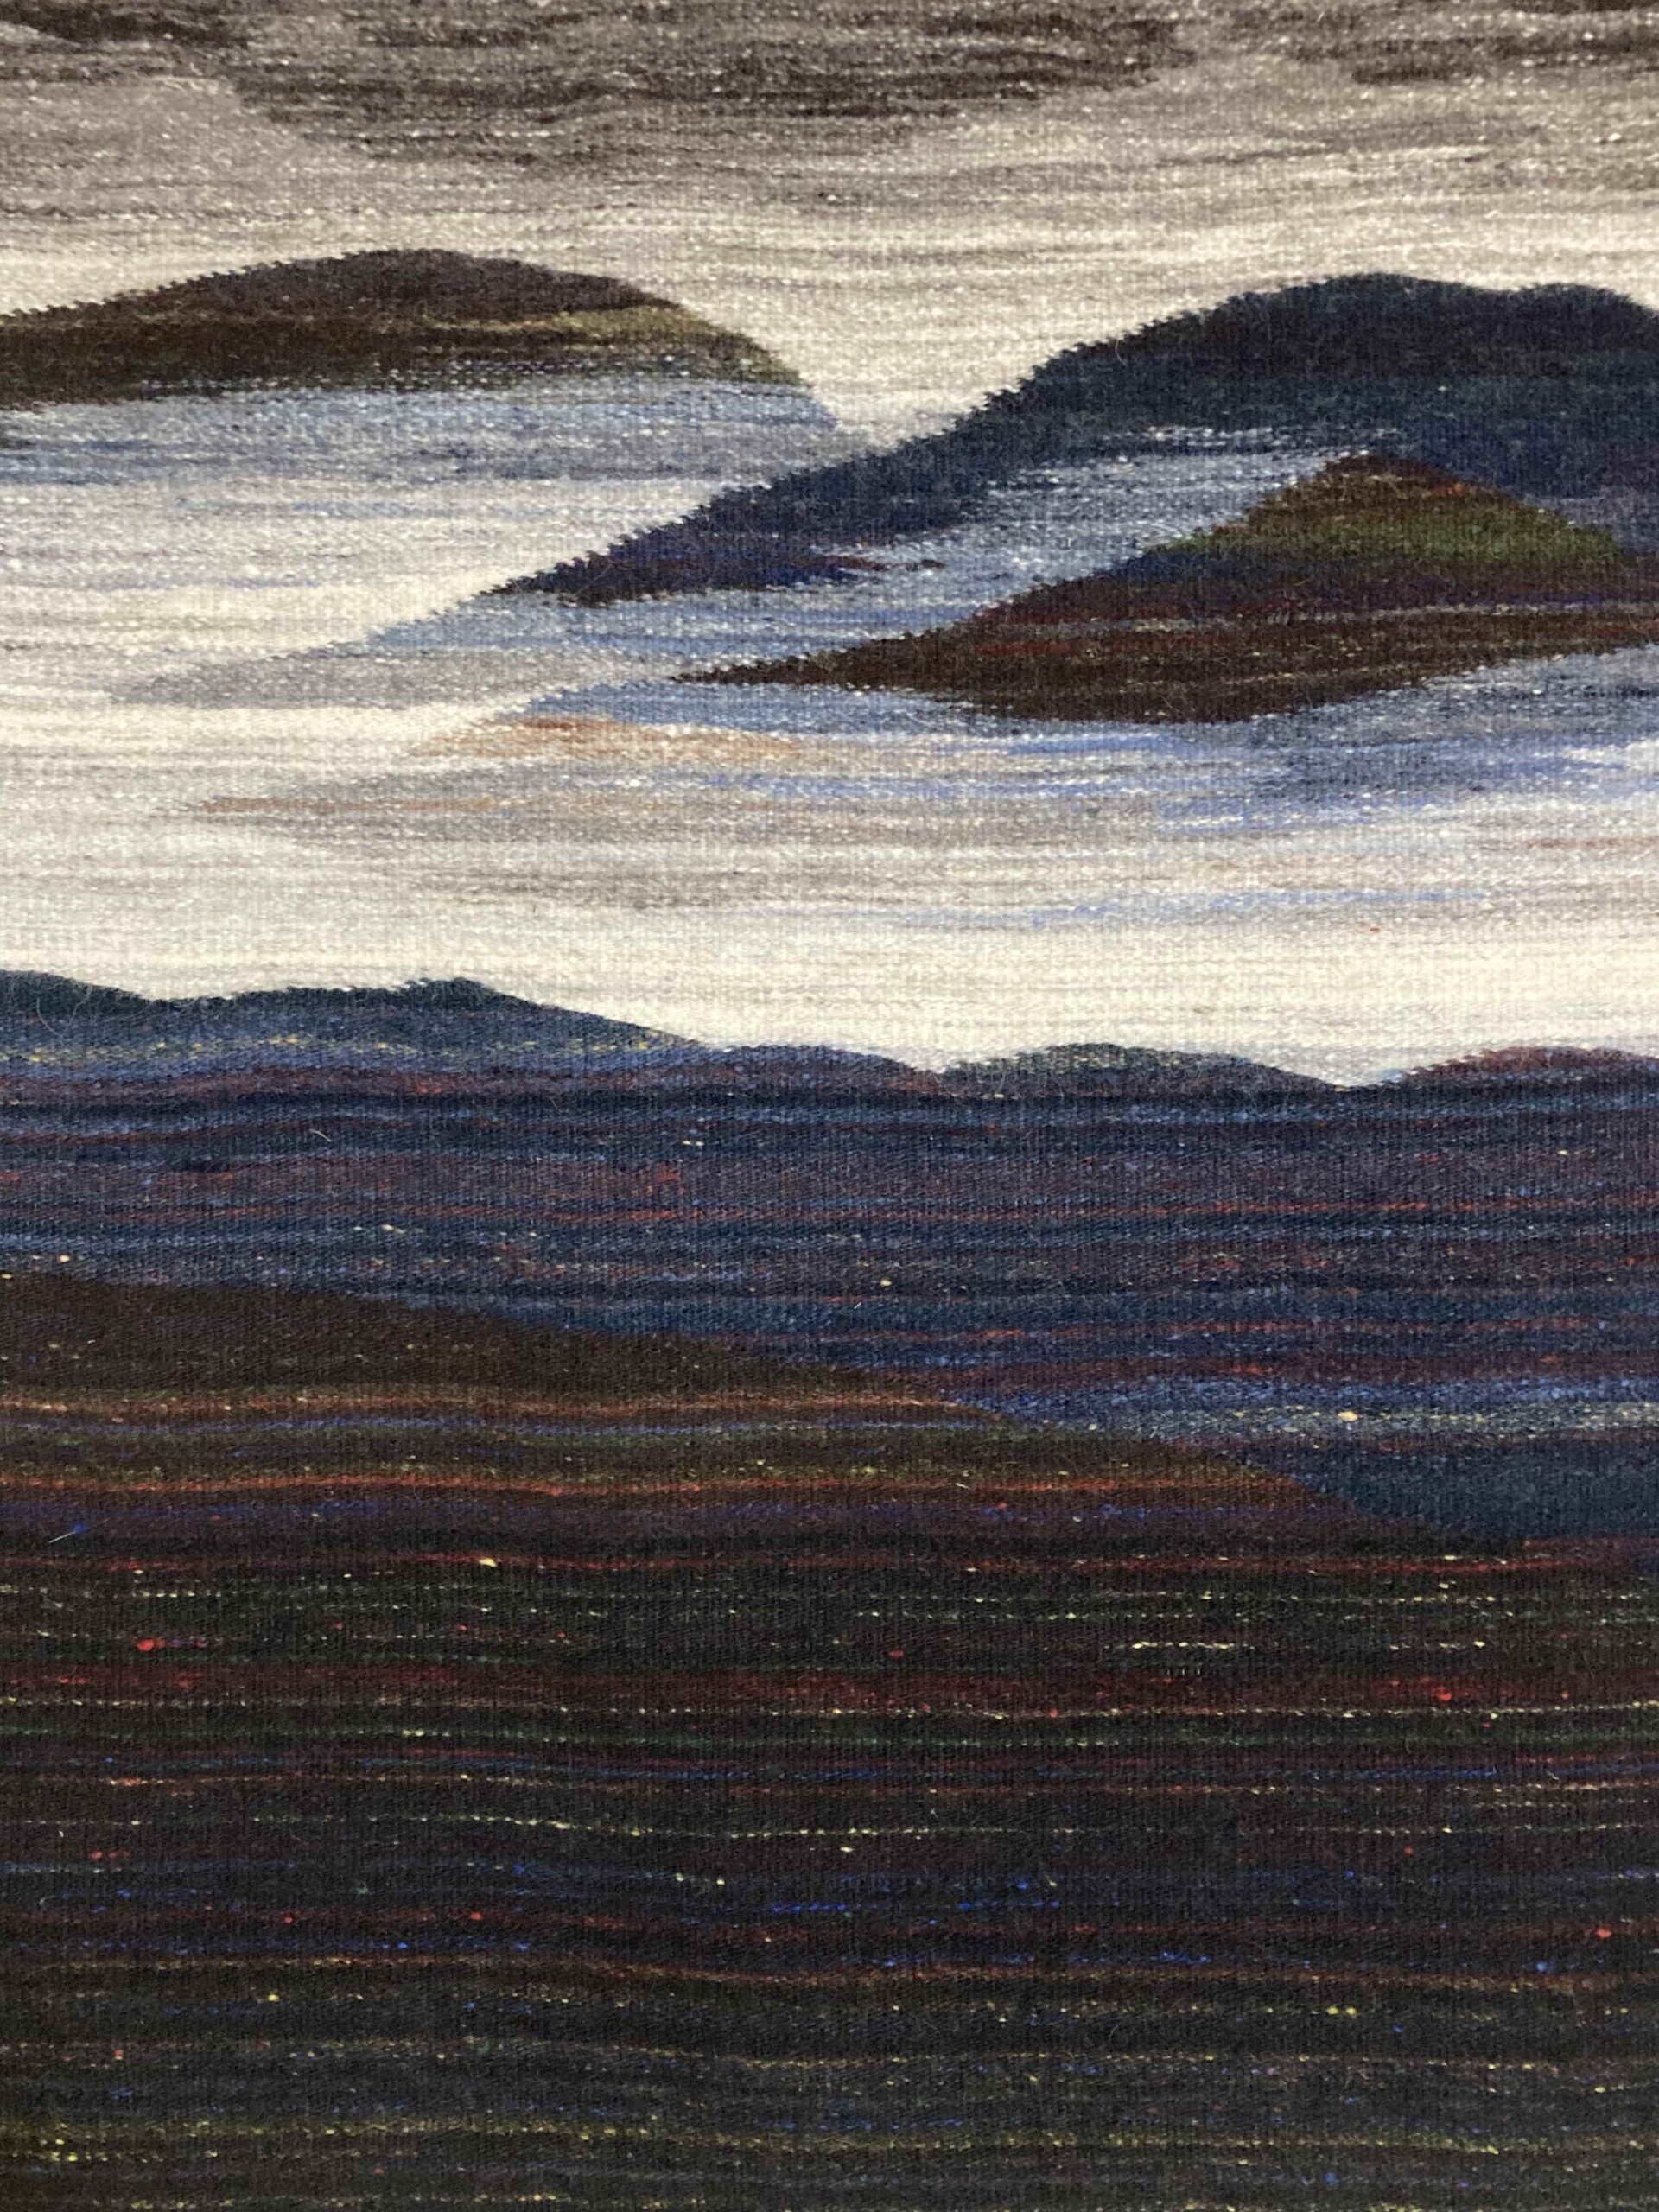
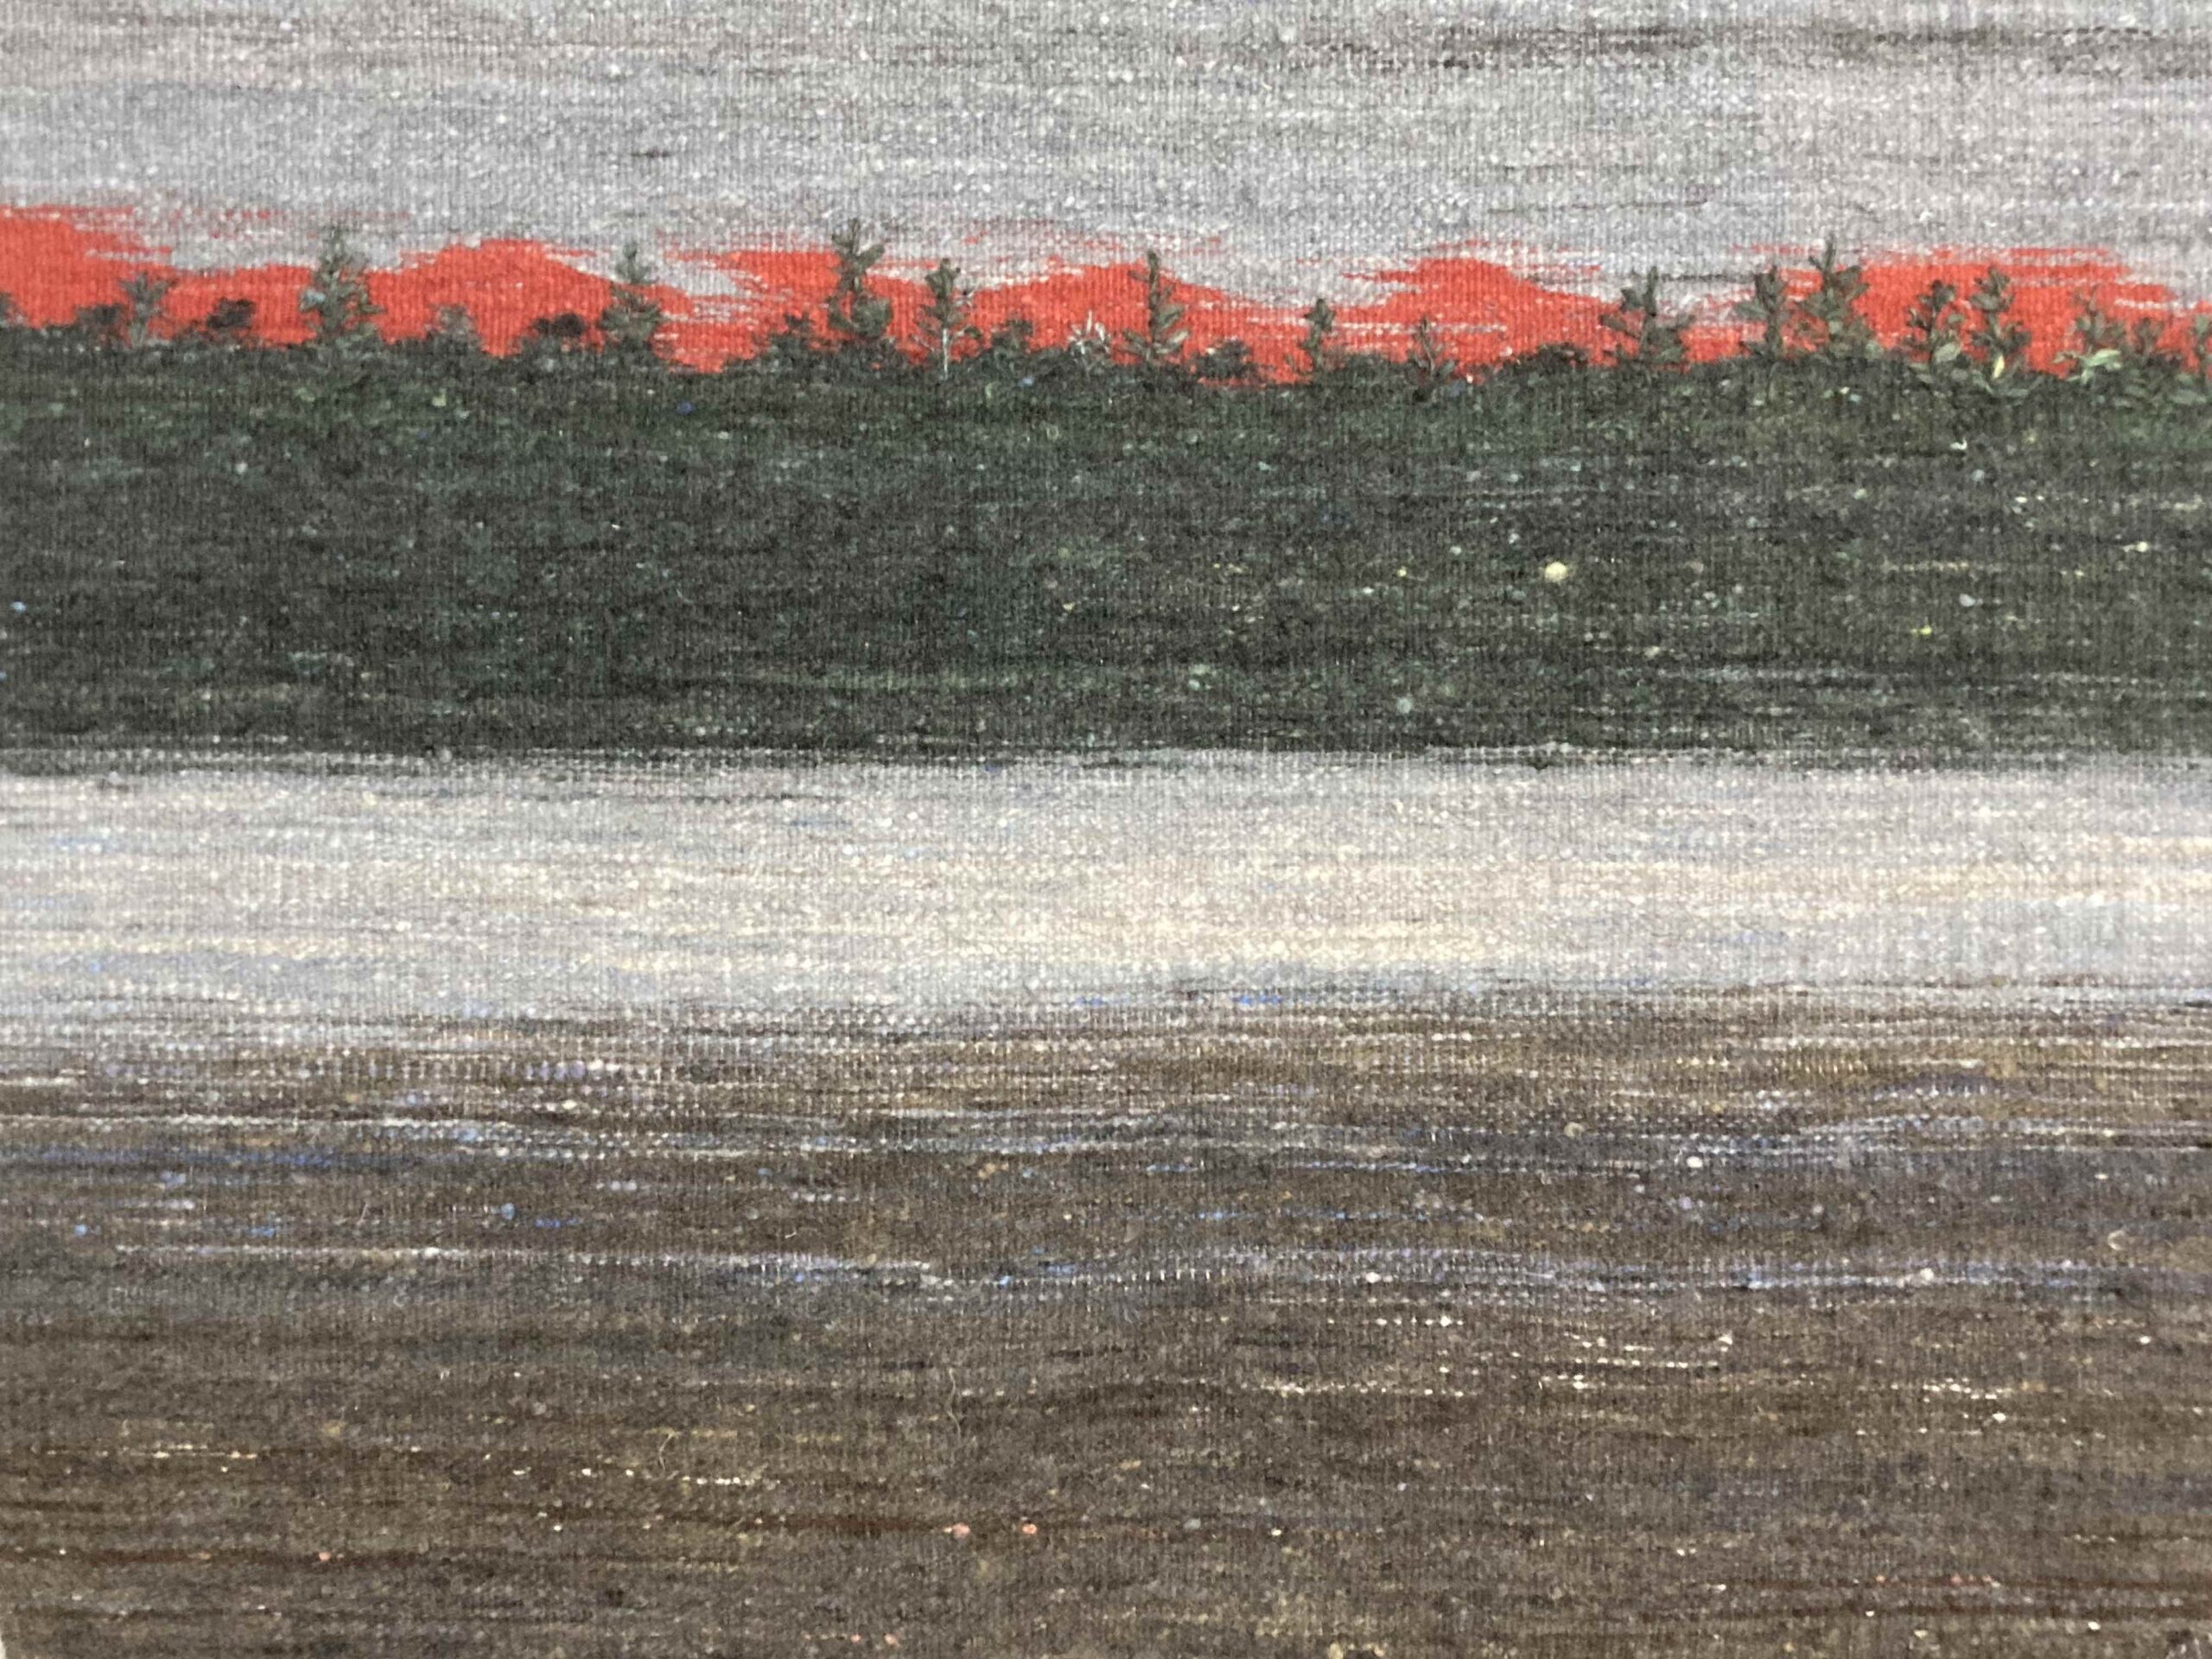
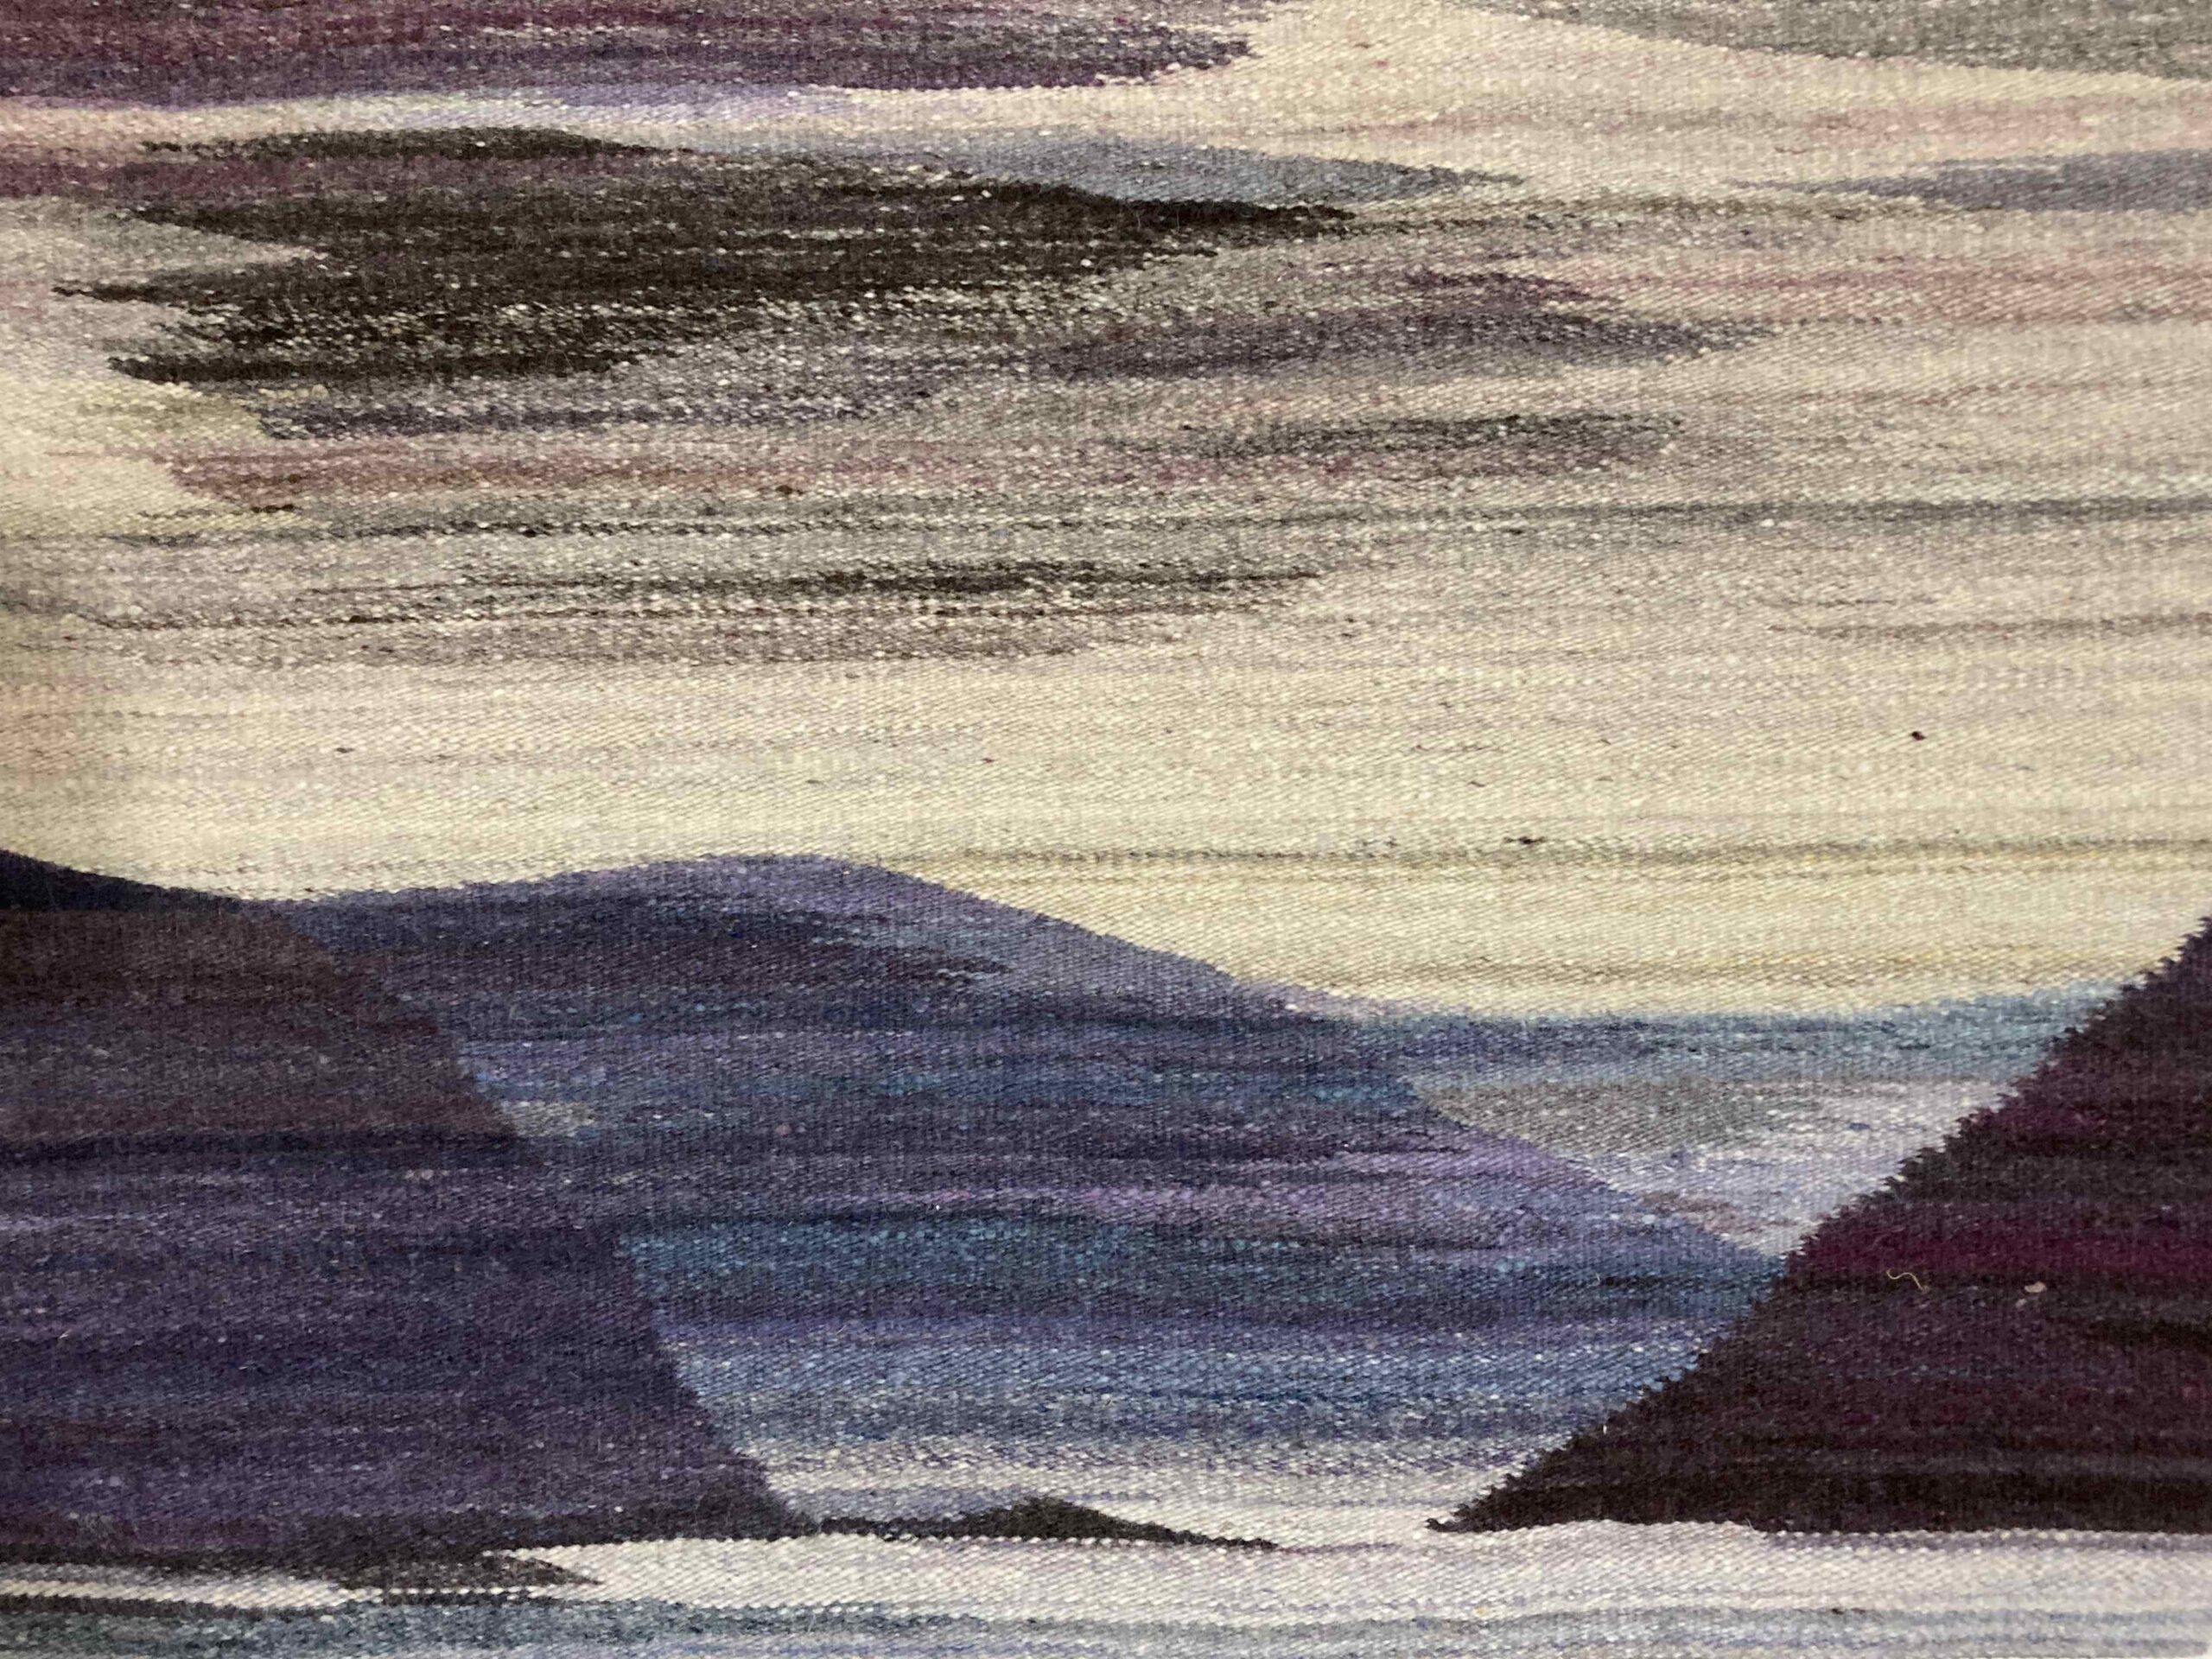
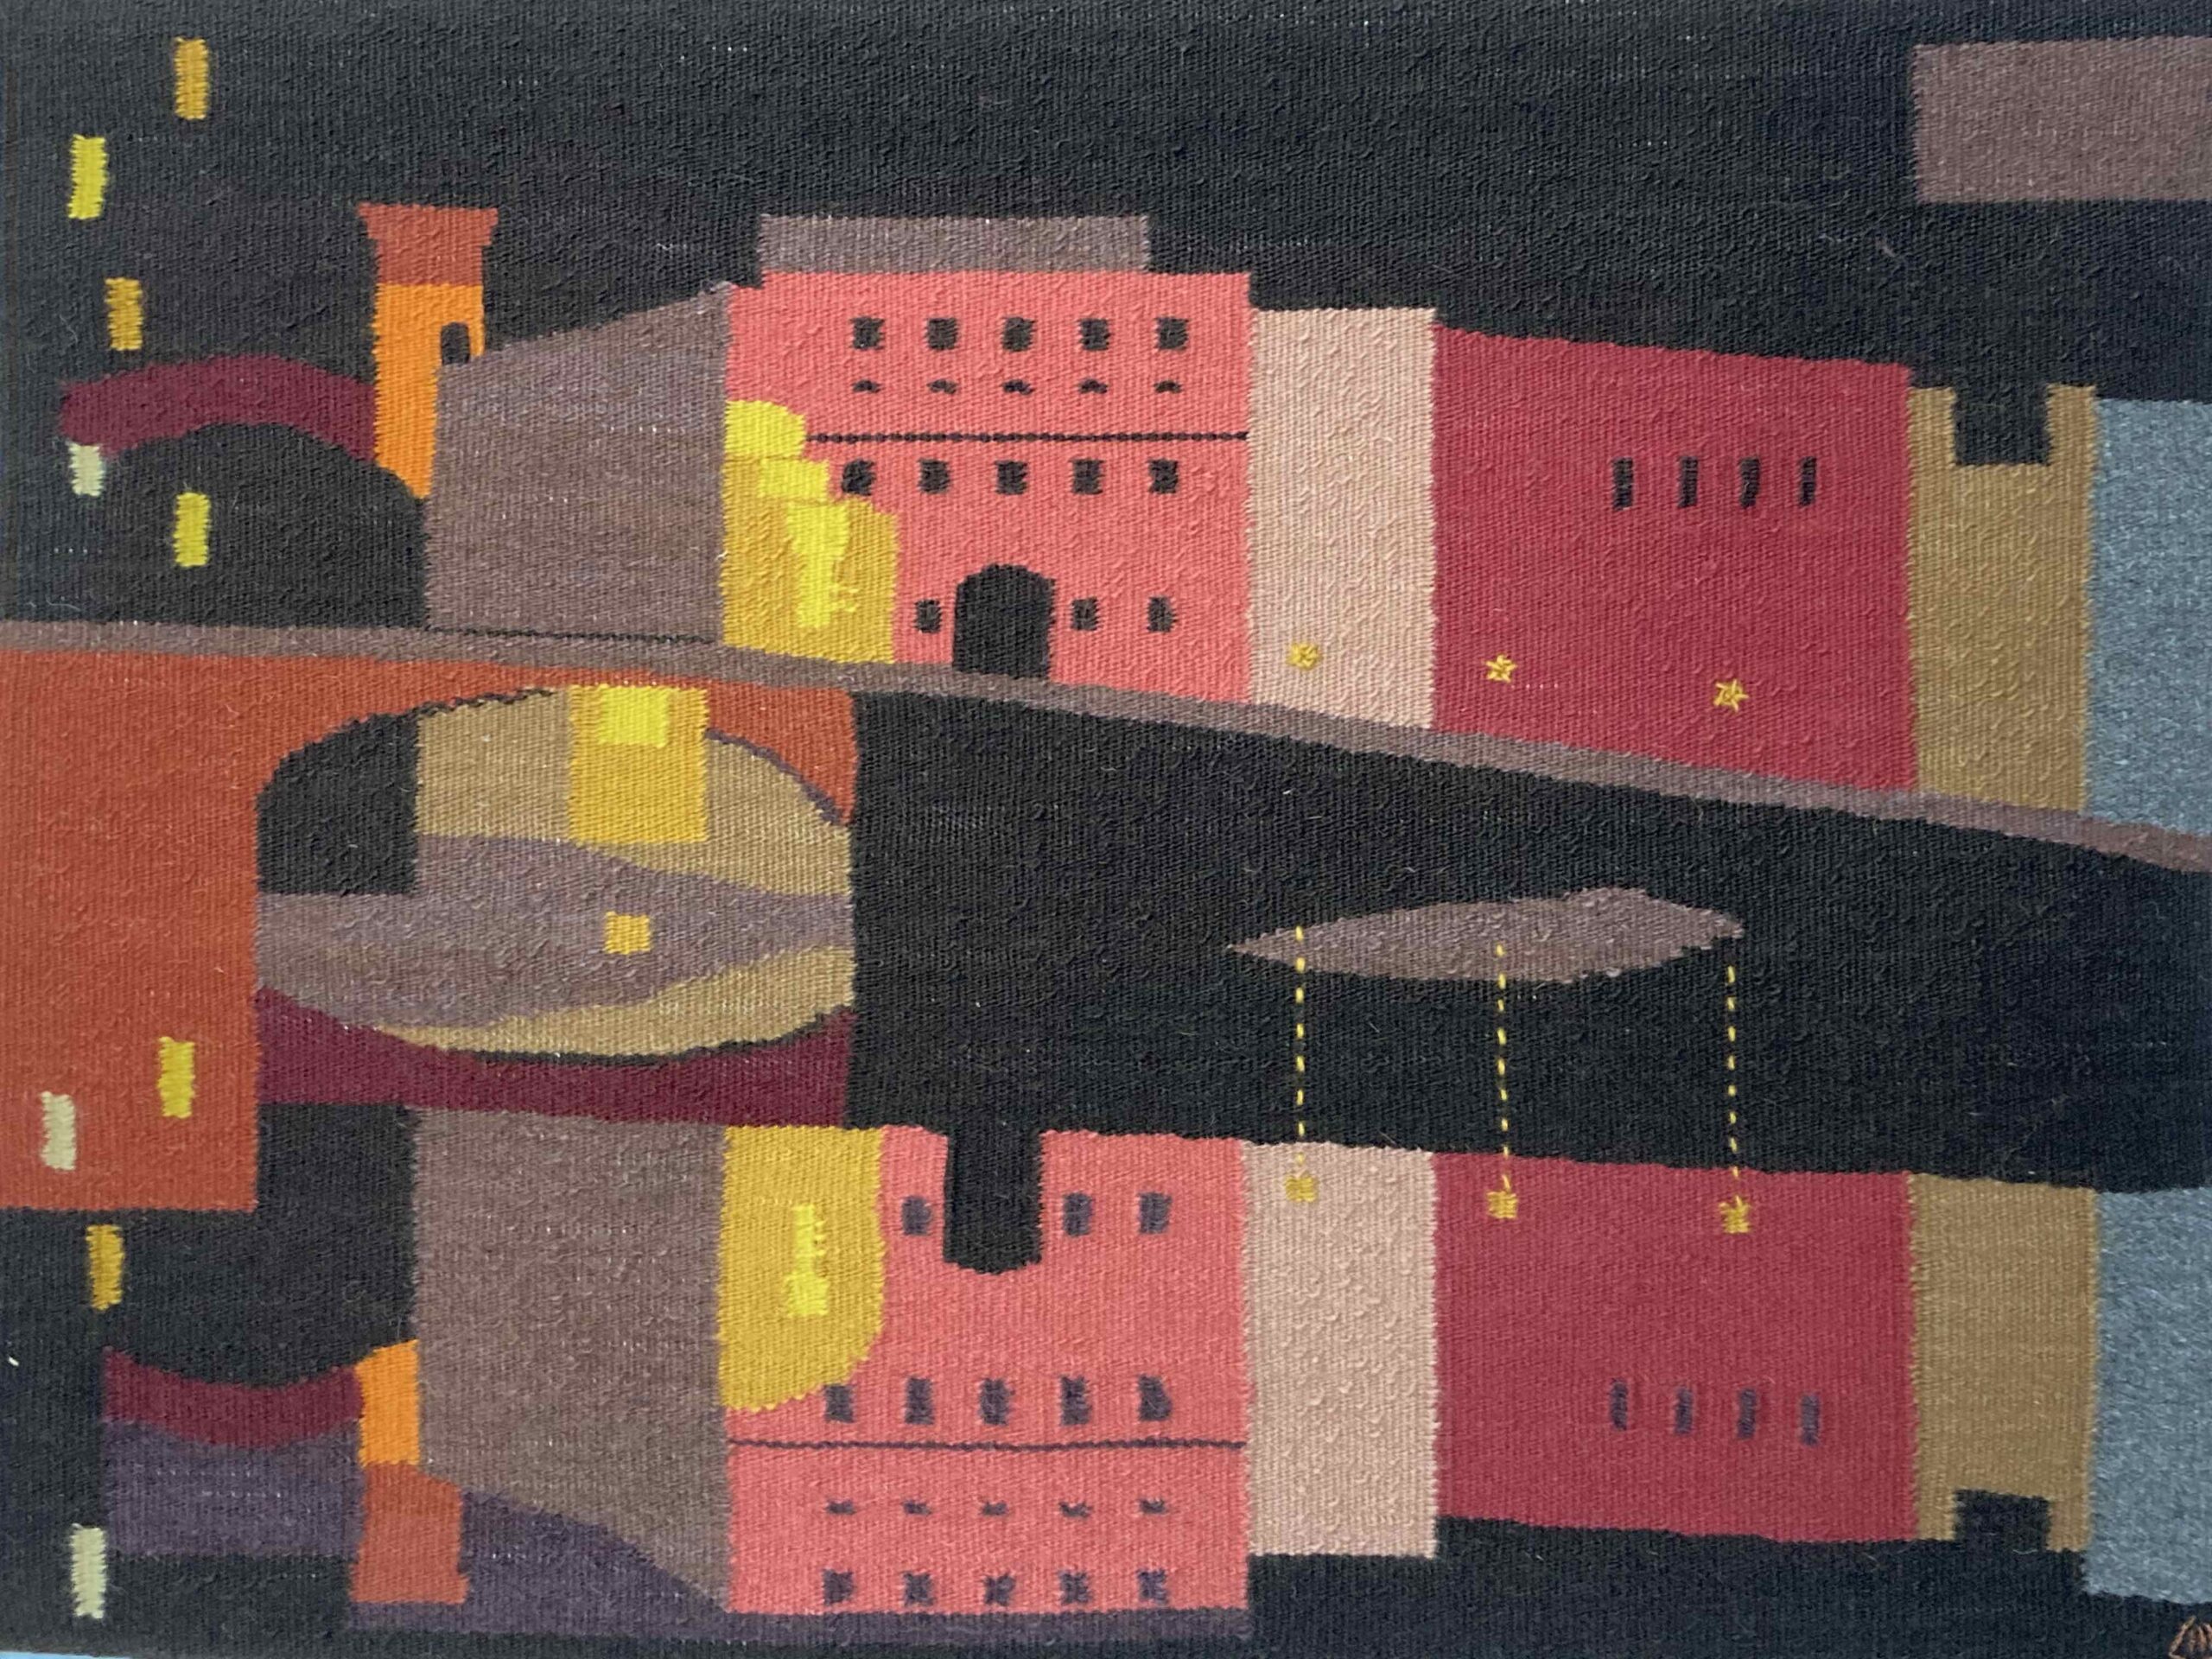
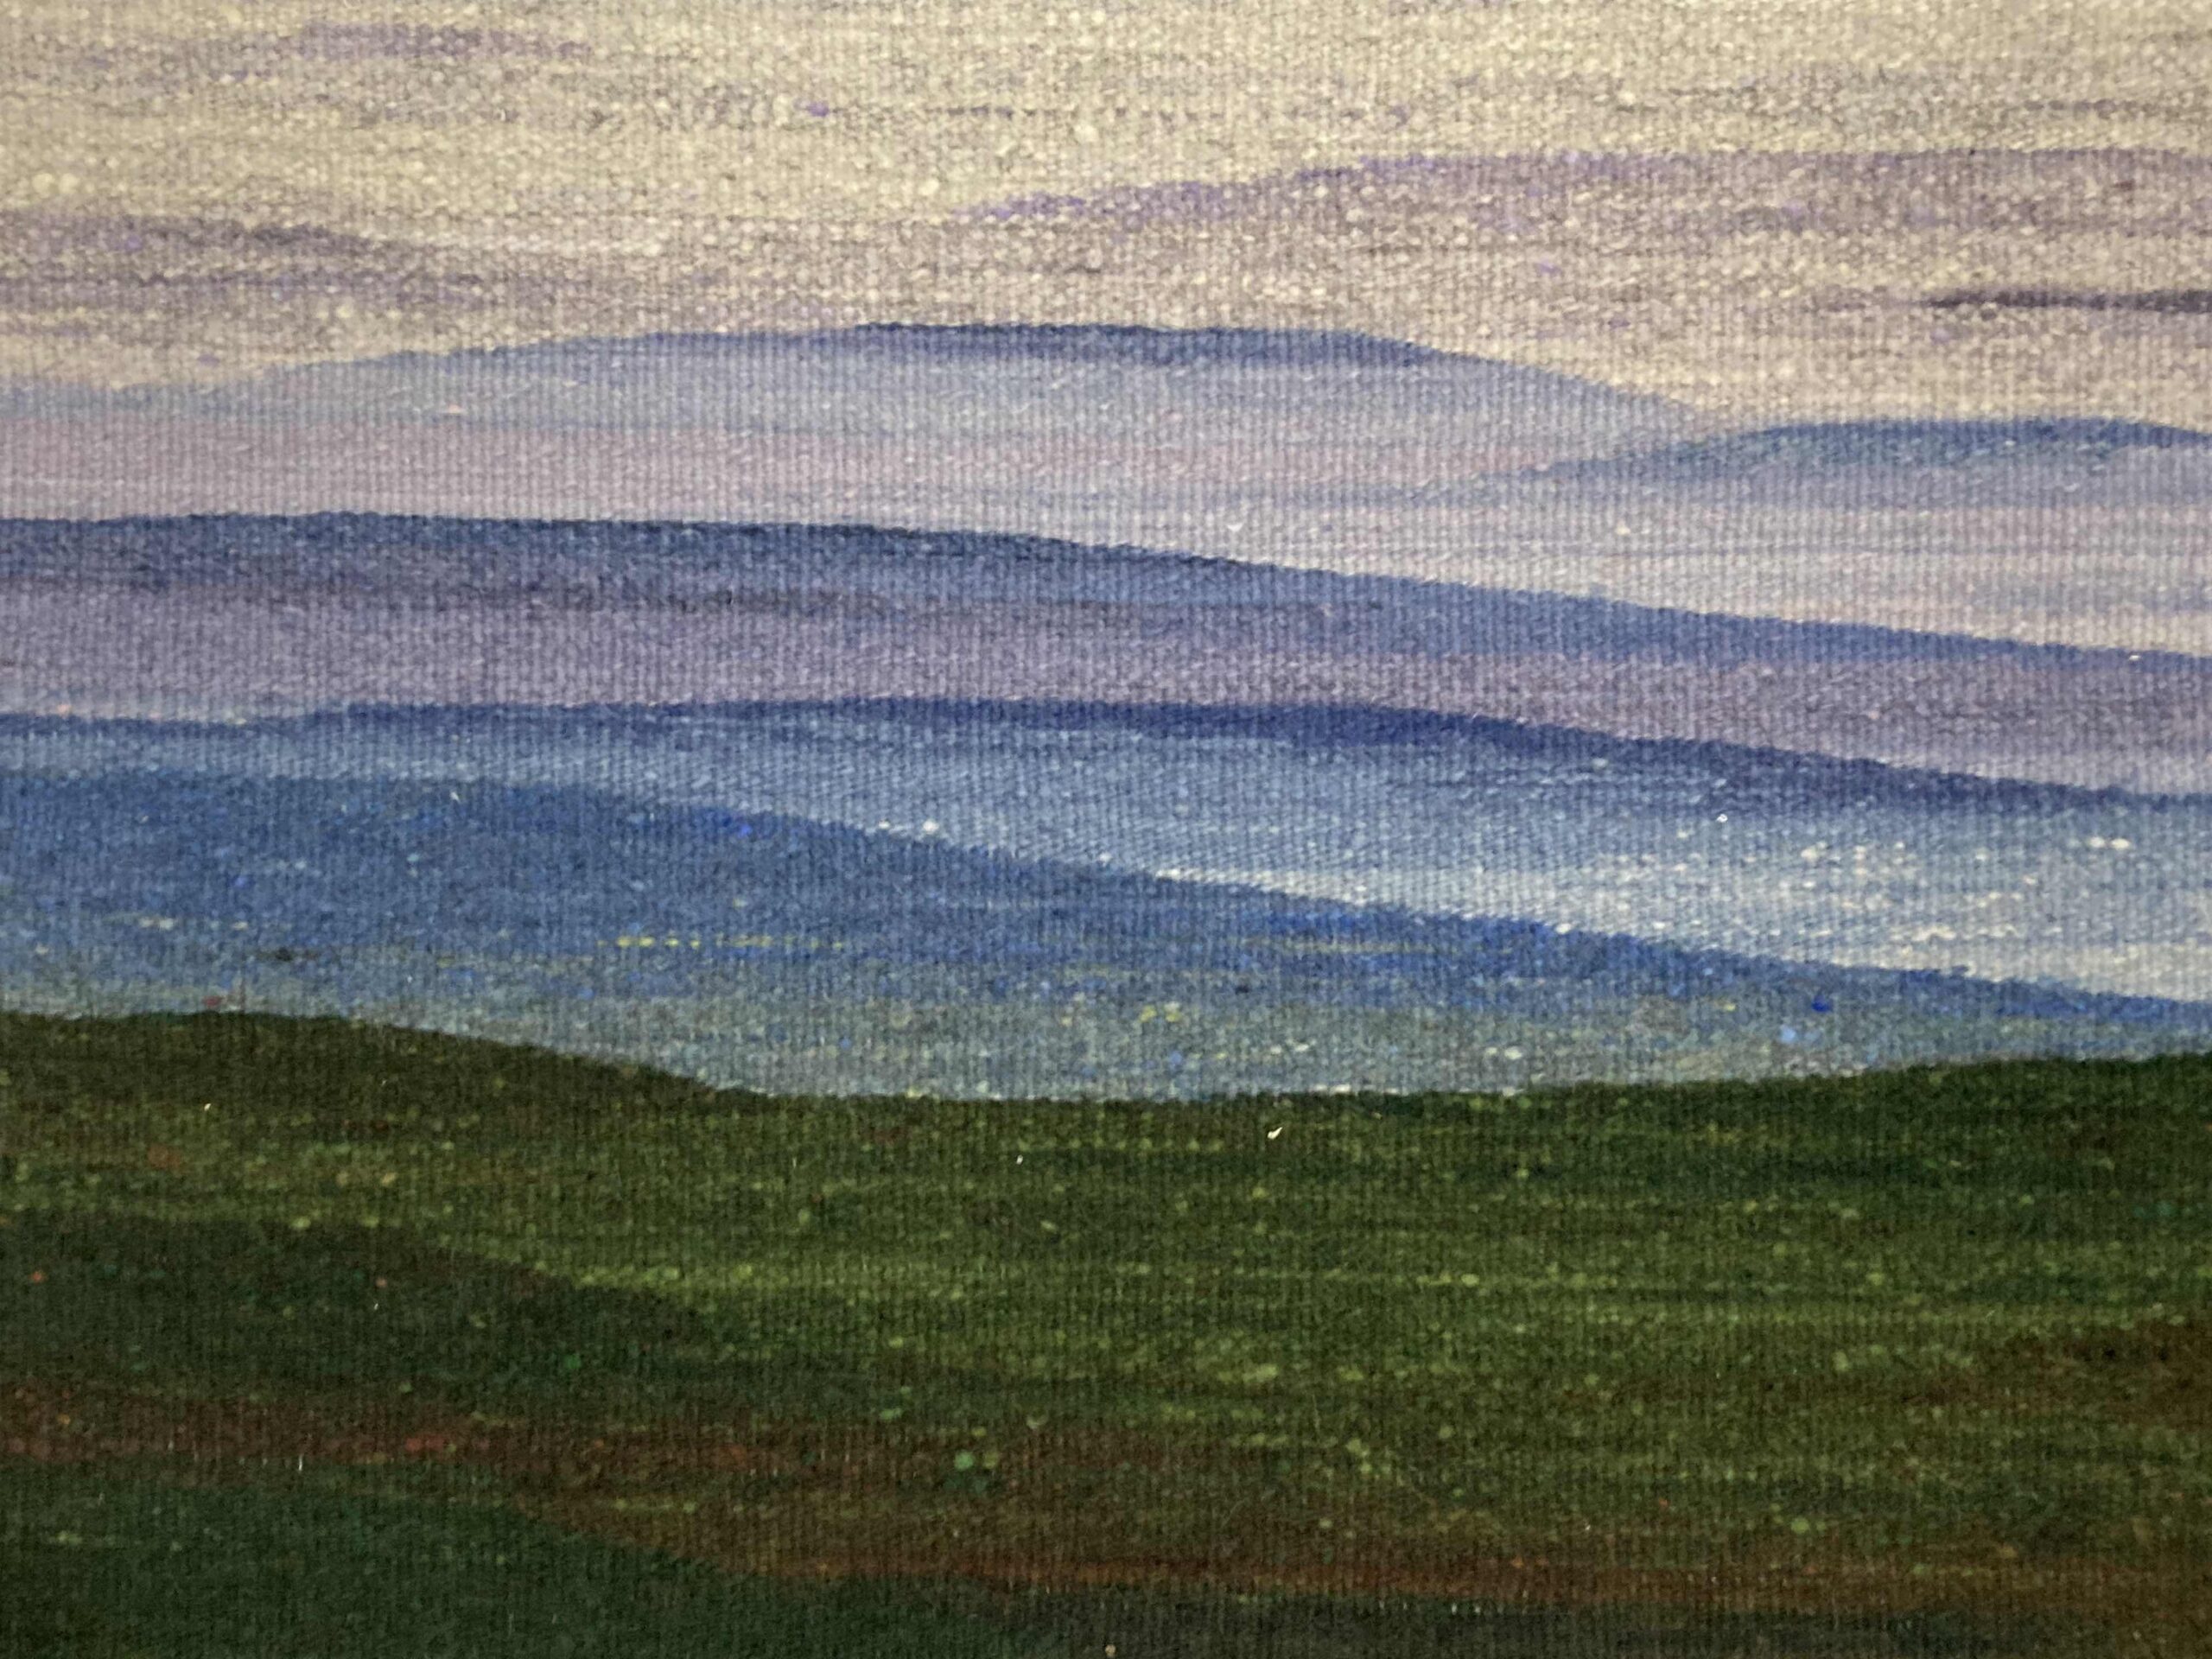
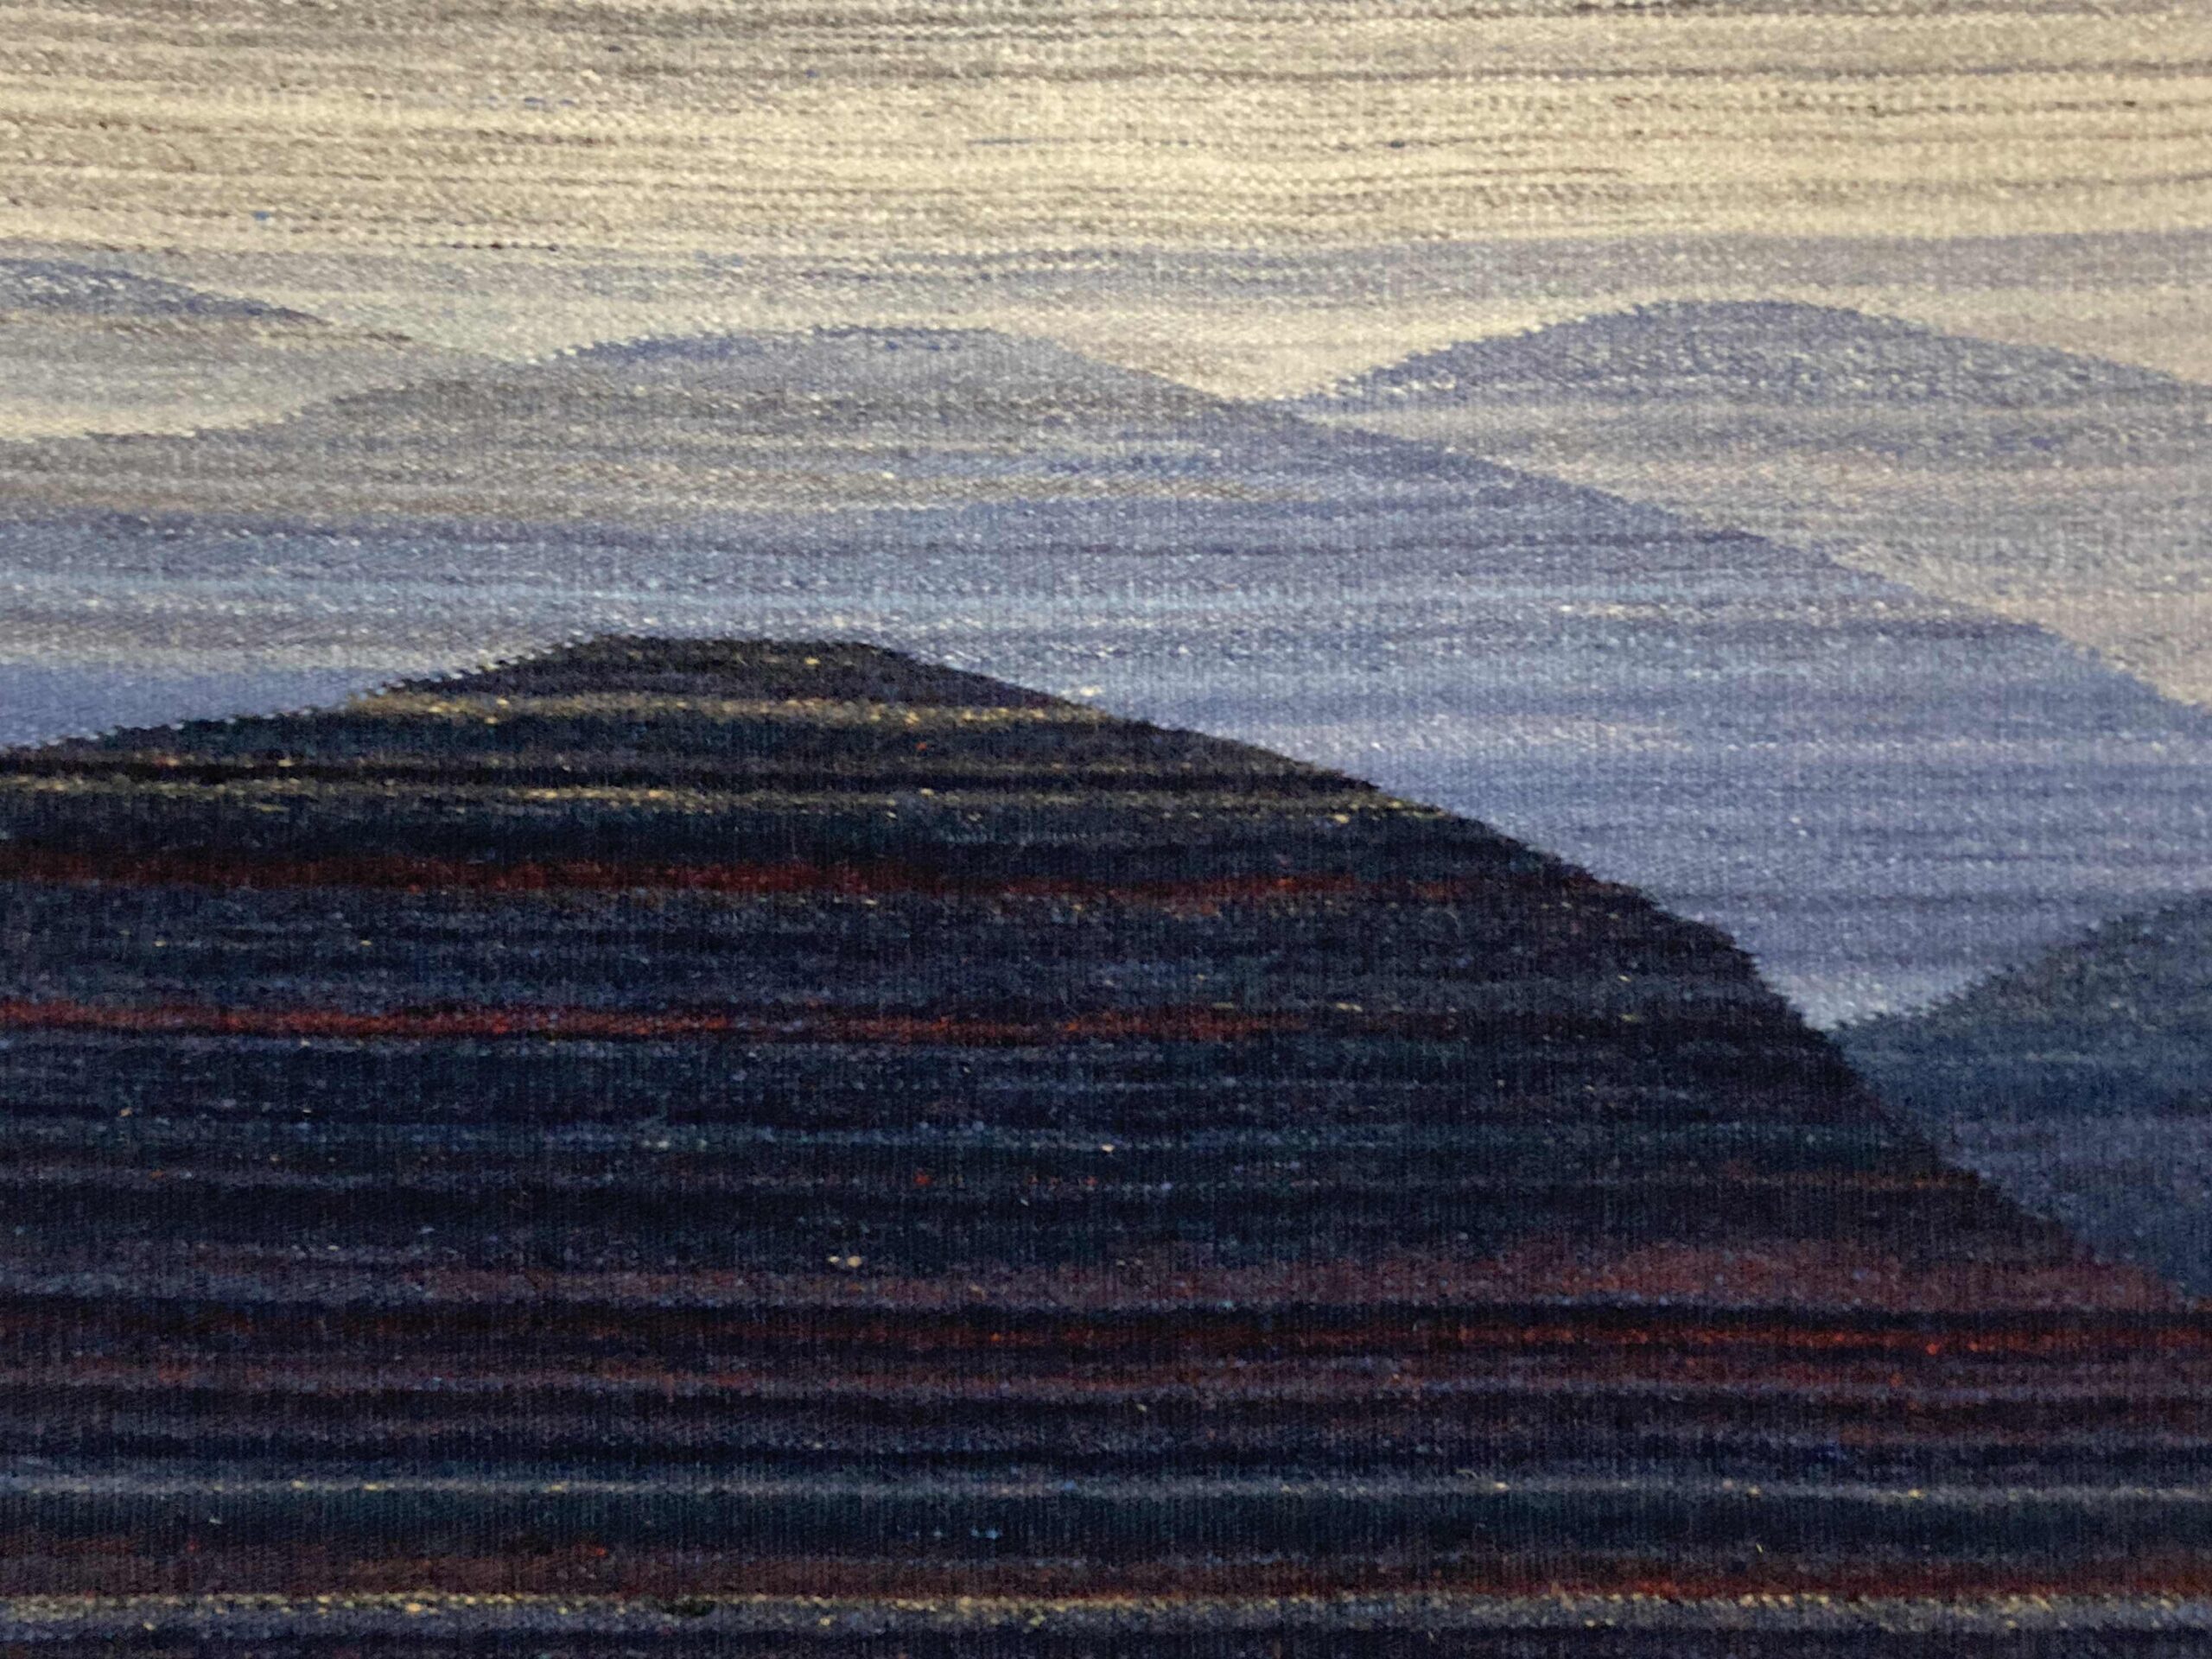
Mina fyra bilder: Berg i dimma, Lofoten, Efter regnet och Blues
Misty Mountain, Lofoten, After Rain and Blues
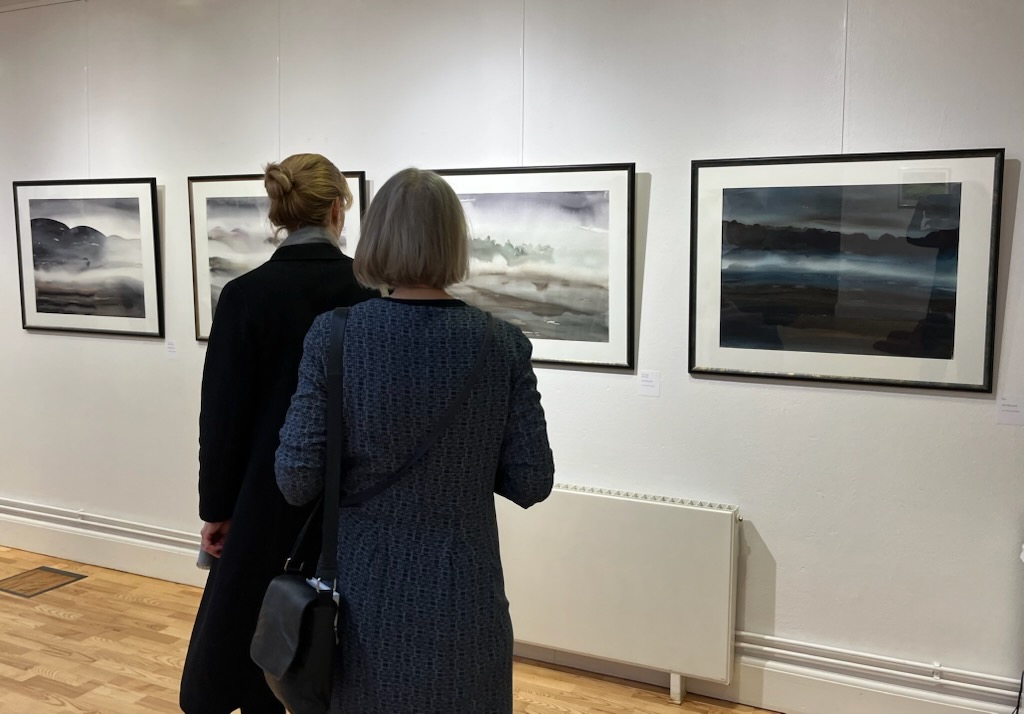
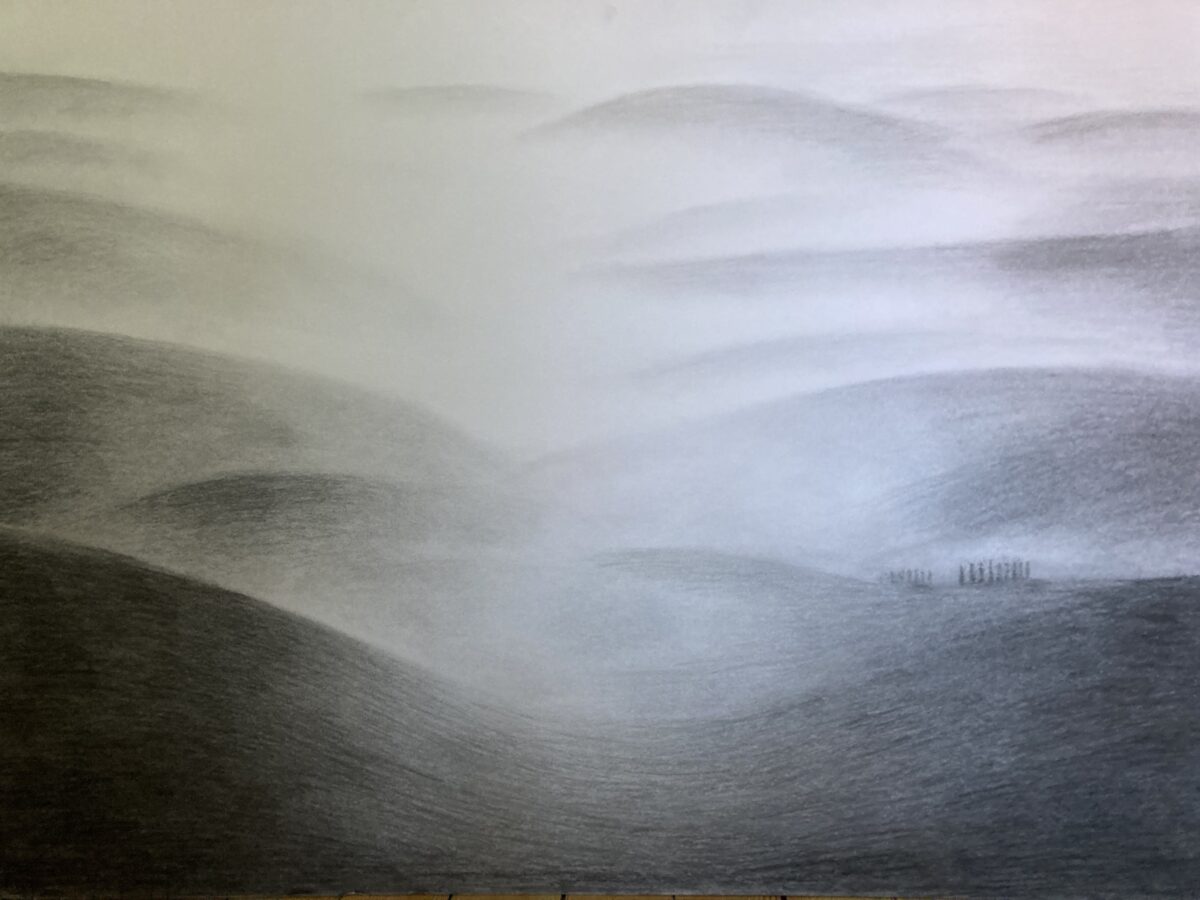
15 mars – 13 april ”Väderleksväder”
Upplands Väsby Konsthall
jurybedömd utställning, två av mina stora teckningar fanns med
Akademihotellets Trapphusgalleri, Uppsala.
1 – 27 februari 2025 separatutställning
2024
1 juni 2024 deltog jag med tre fotografier
KULTIS på Walmstedtska gården
Sysslomansgatan 1, Uppsala
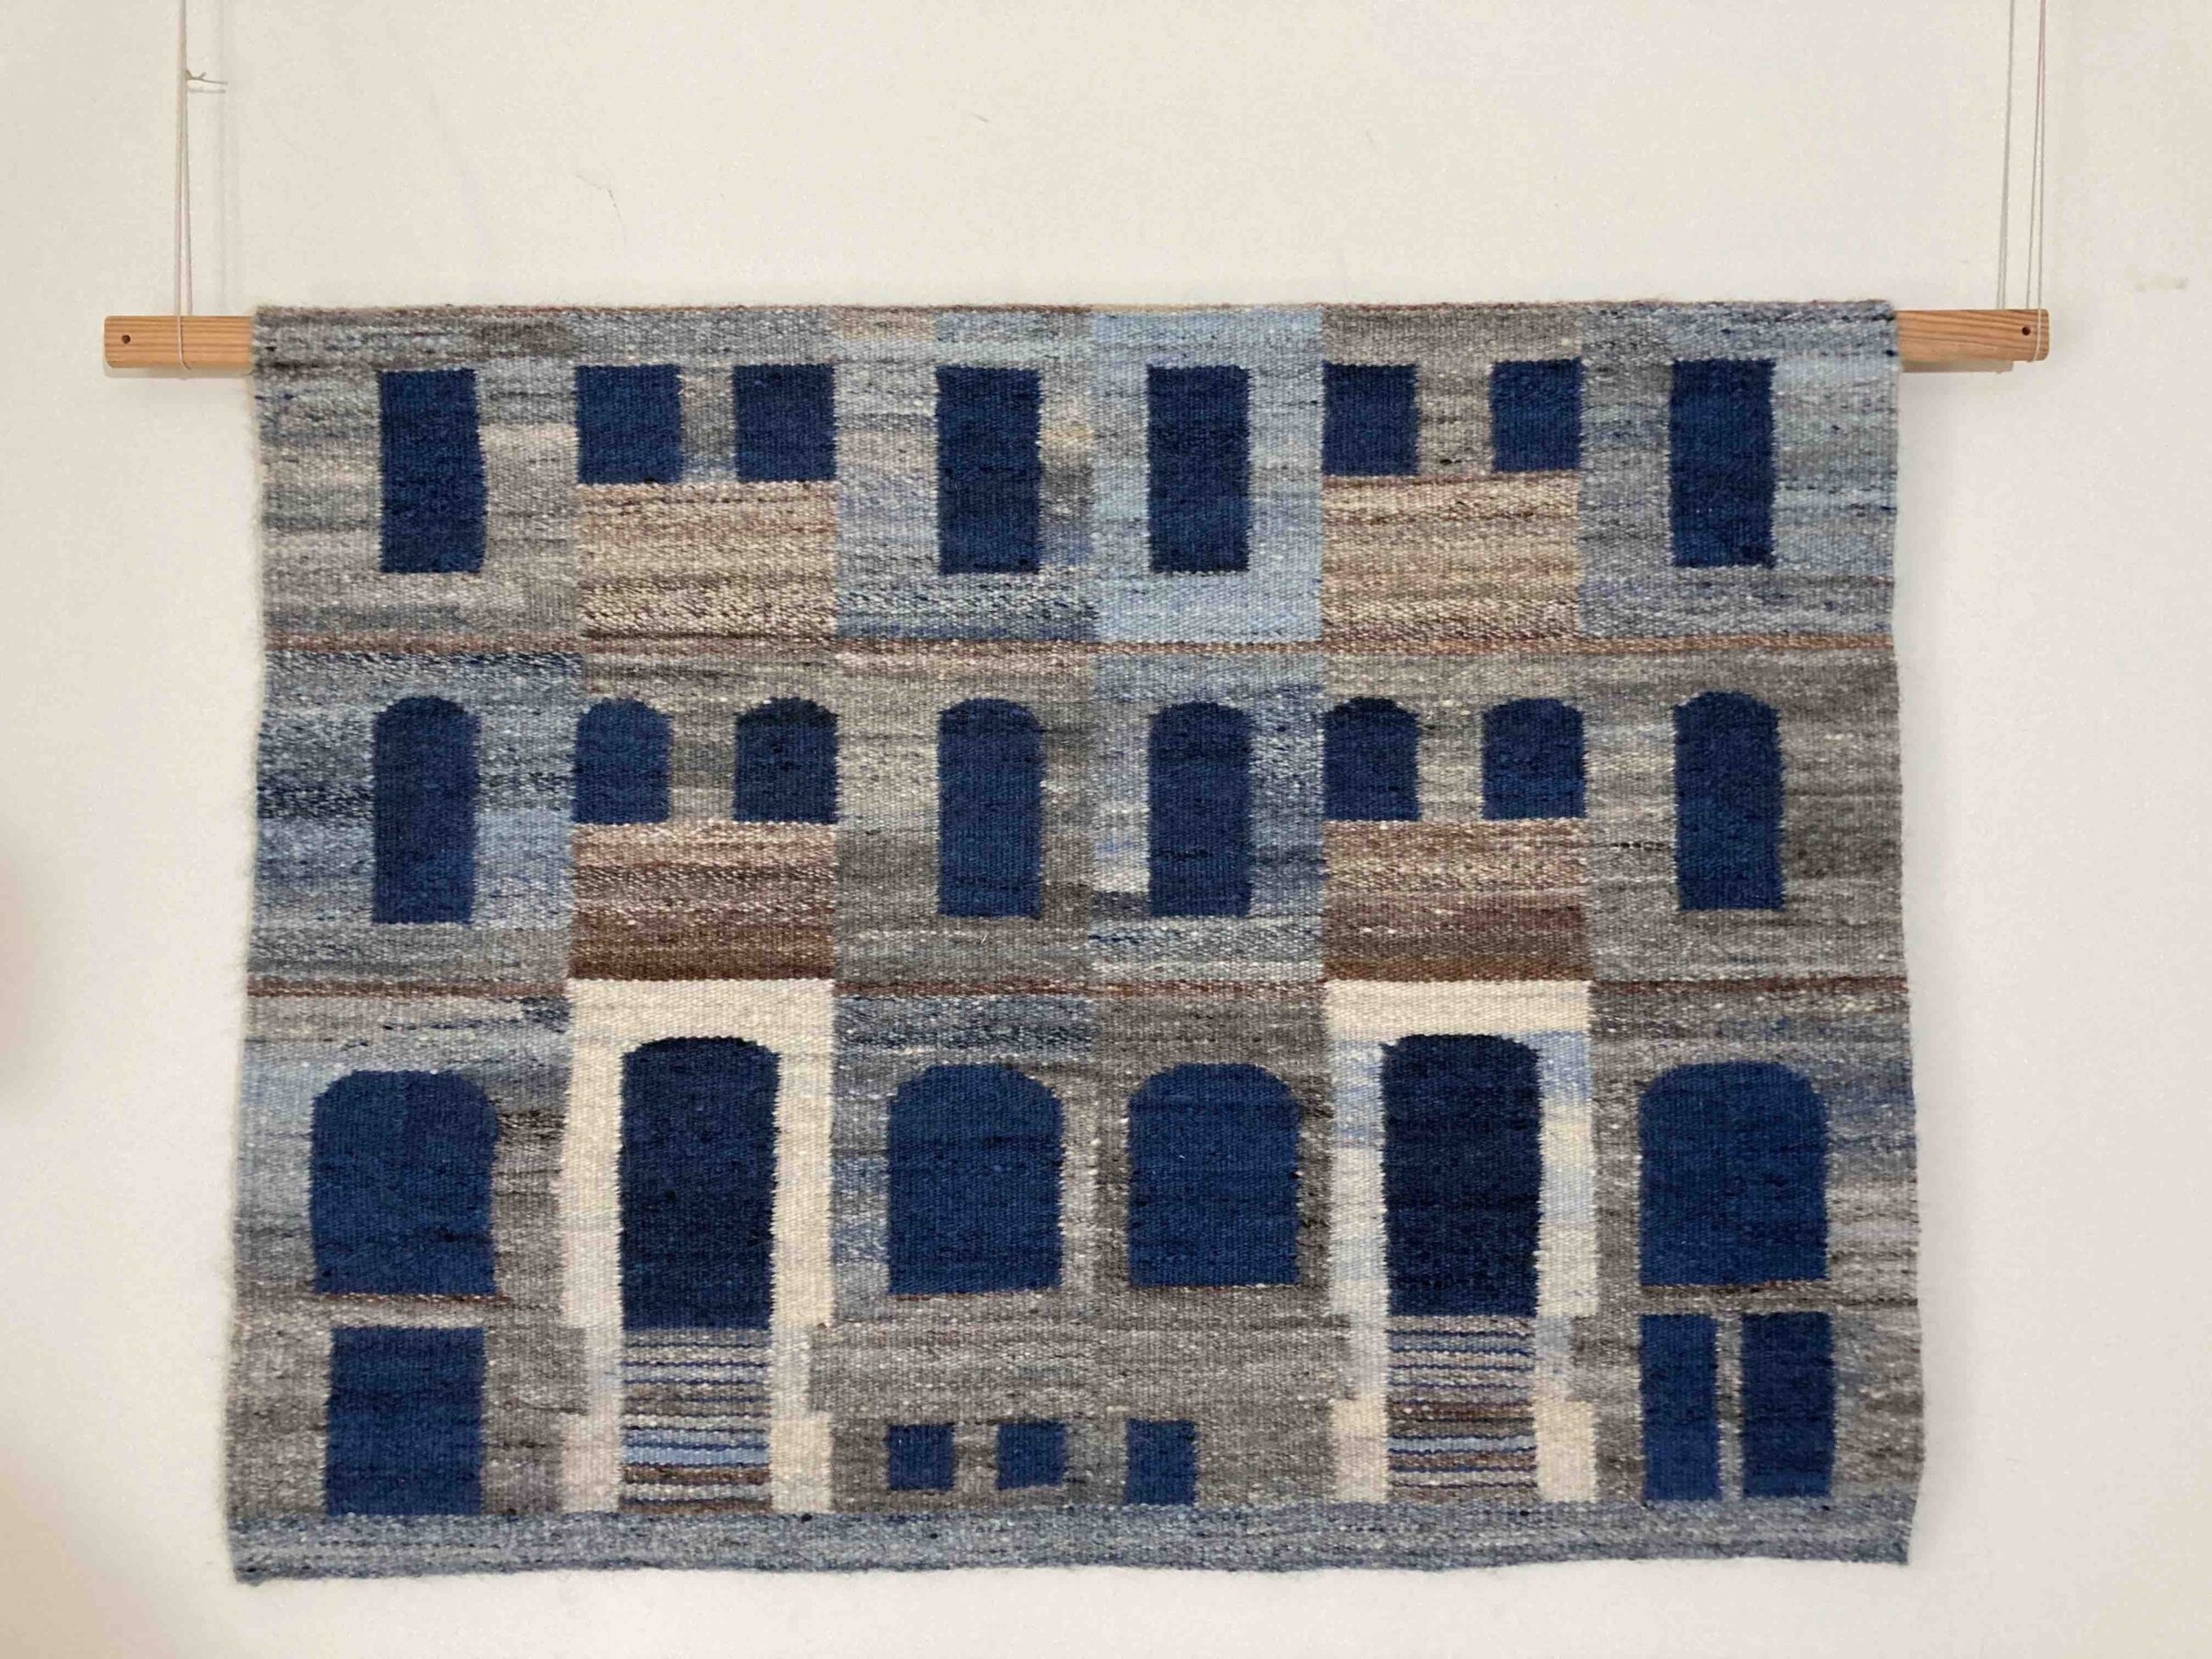
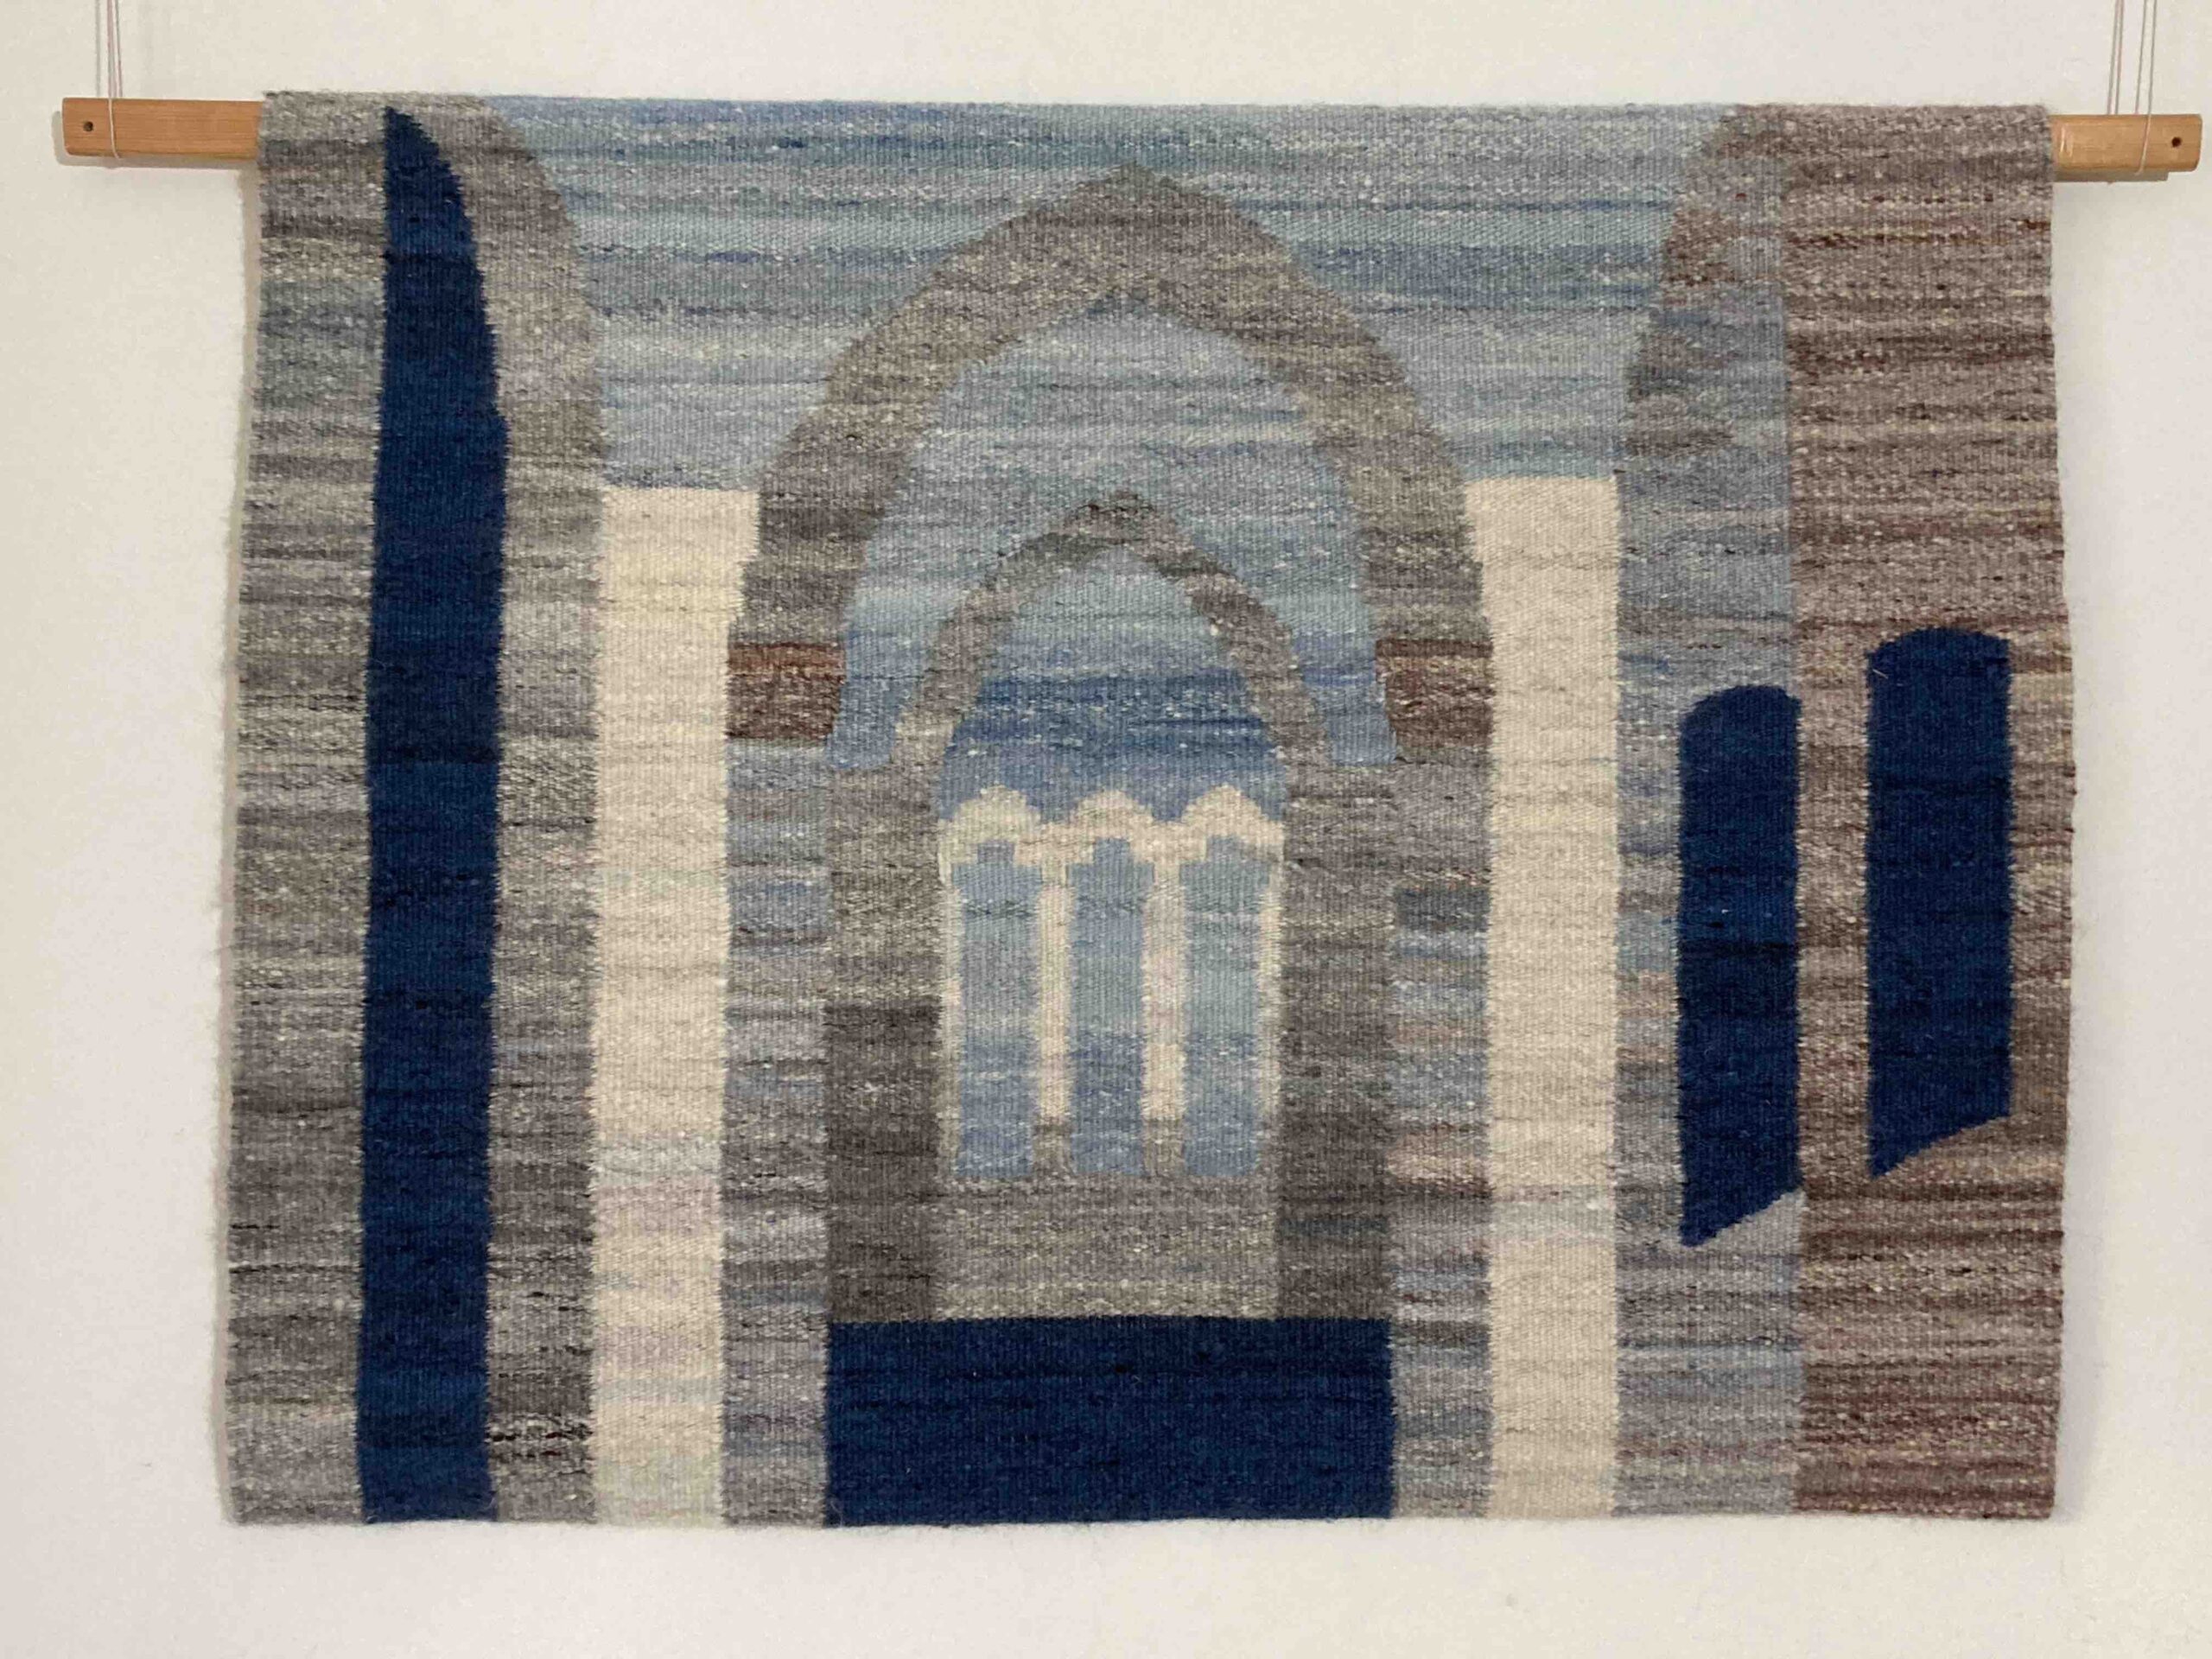
BILDVÄVAR I WISMAR
24 april – 1 juni deltog jag i en Adelanteutställning
i Galerie hinter dem Rathaus i Wismar
www.adelanteart.com
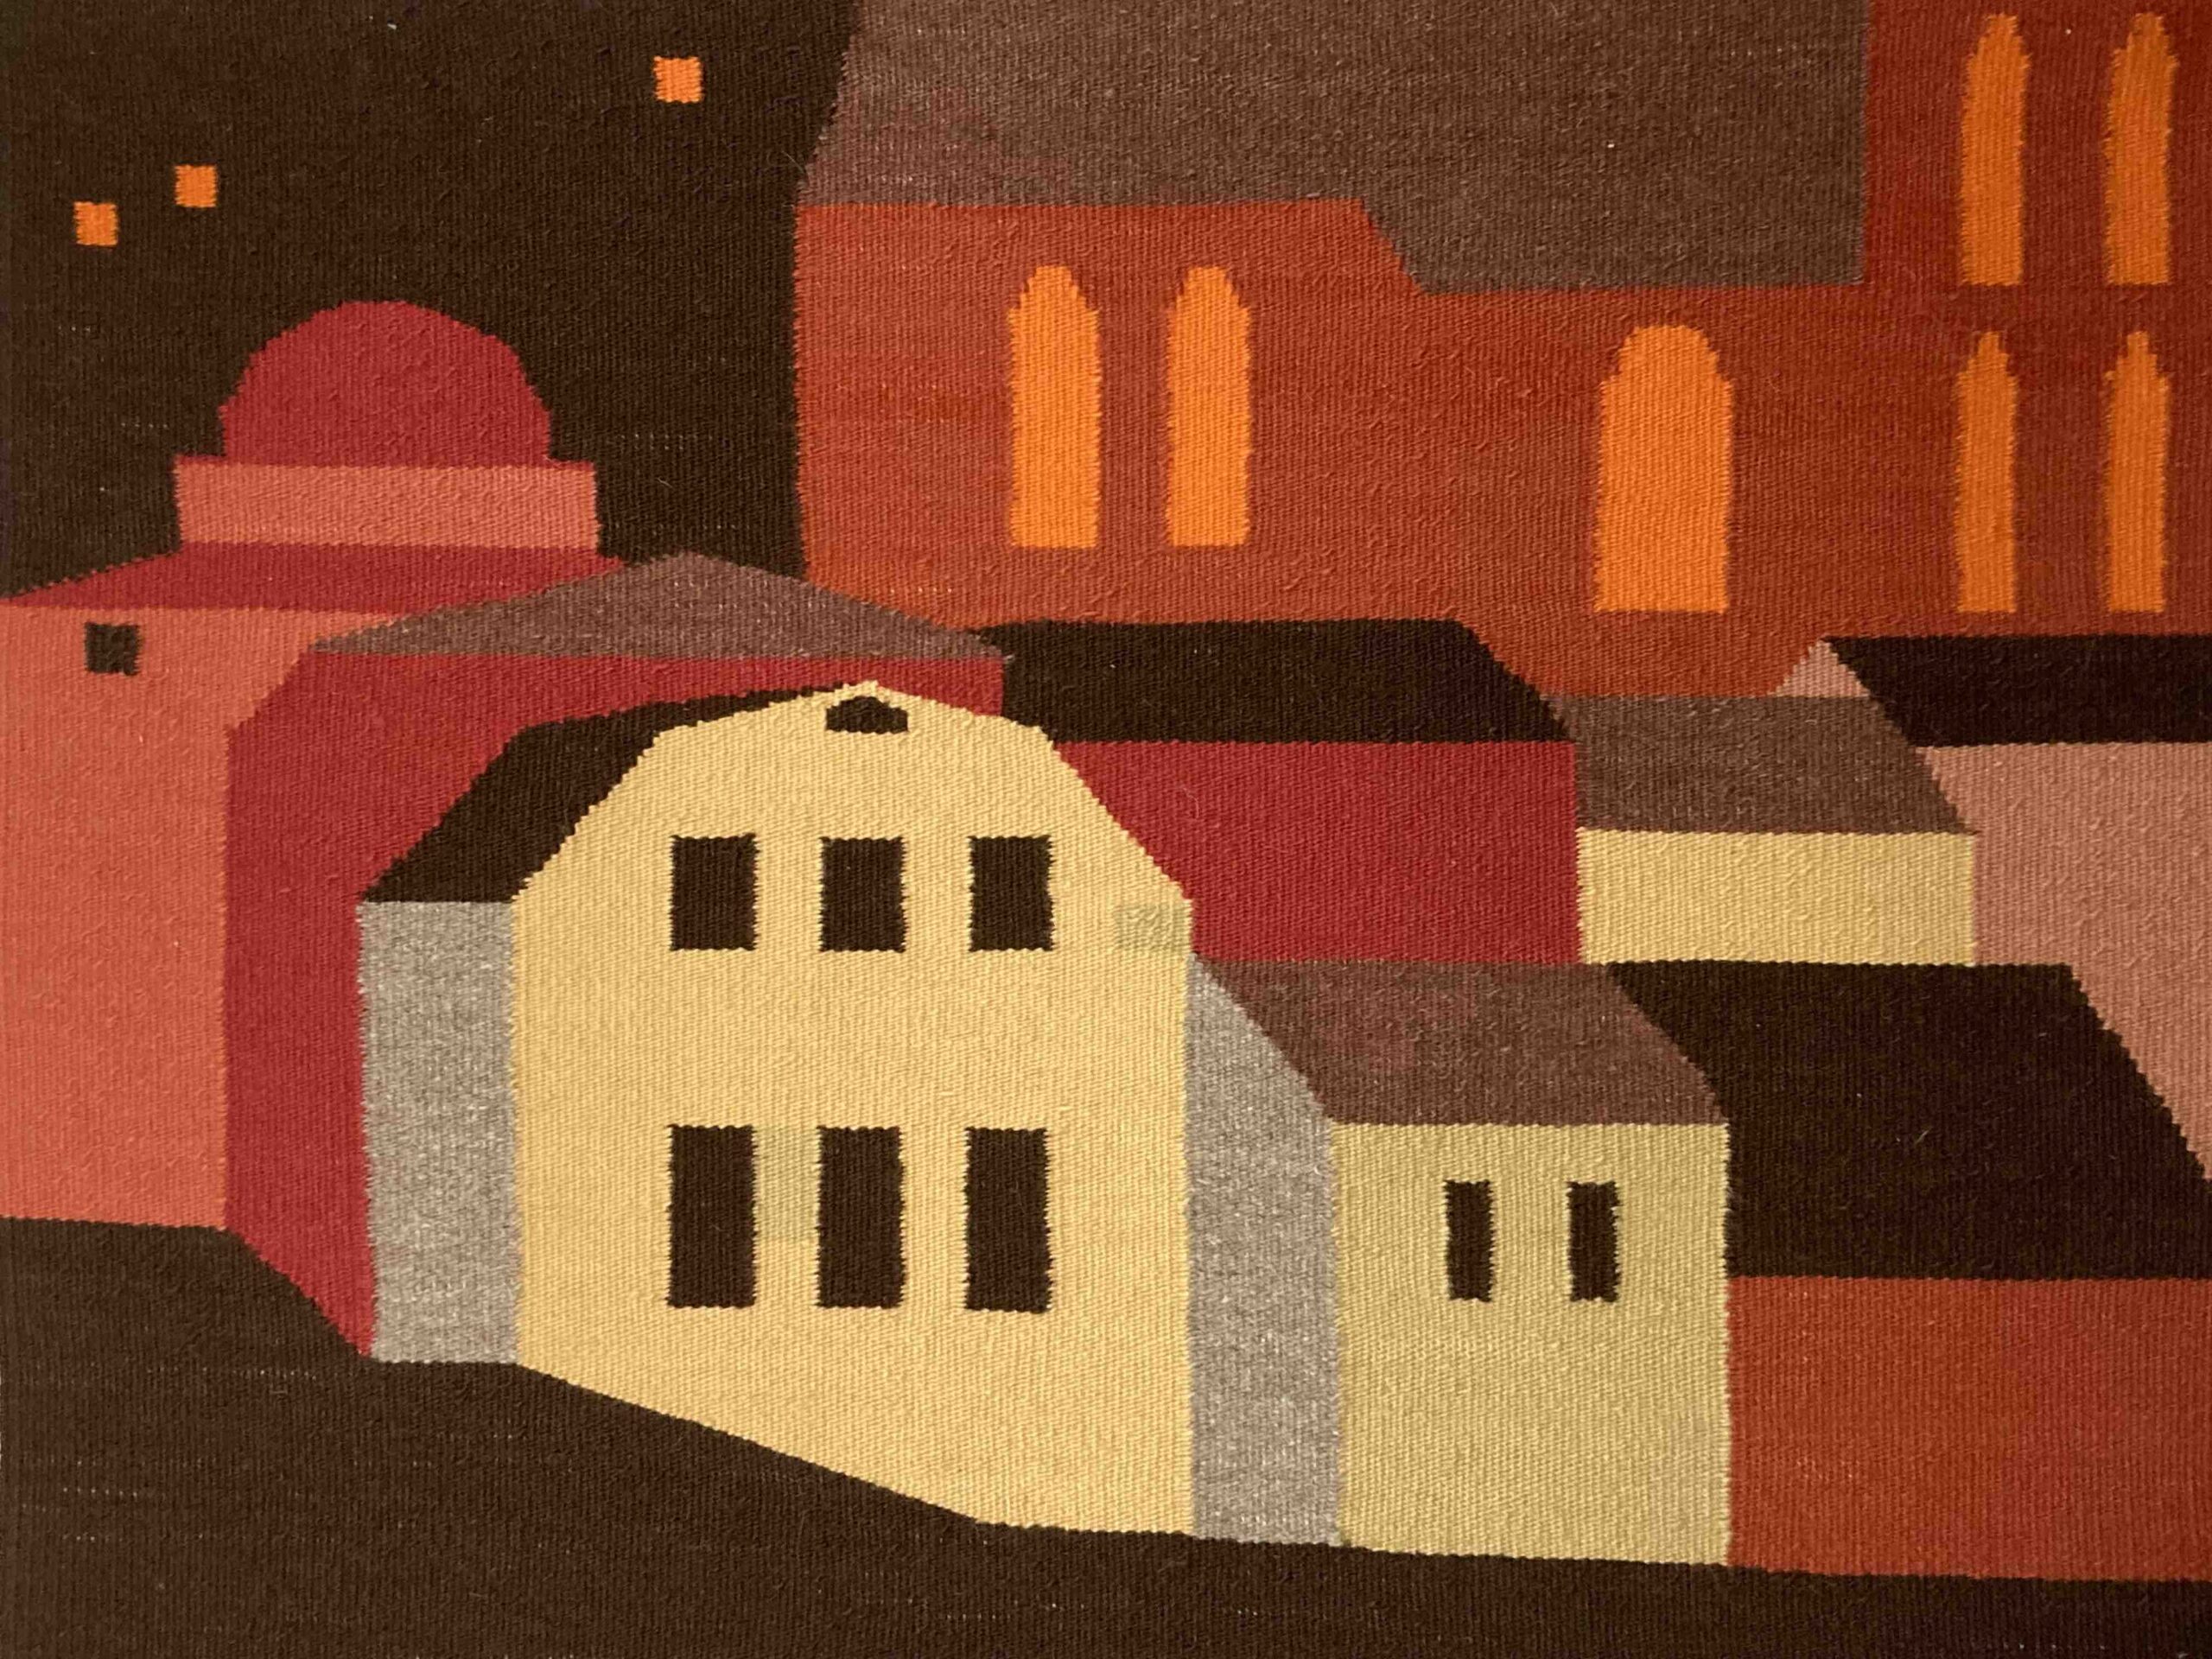
Jag visade 14 bildvävar i Missionskyrkan, Uppsala
14 januari – 8 februari 2024
Film på youtube googla på ”Från mörker till ljus” Lill Sjöström
Film på youtube googla på ”Från mörker till ljus” Lill Sjöström